
ABSTRACT
Objectives: To determine the adequacy of Army recruits’ usual diet before the commencement of training. To identify problems which may be addressed in future preventative health programs.
Design: Recruits completed a health and diet questionnaire, were weighed and donated a fasting blood sample for measurement of cholesterol, fasting triglycerides, apolipoprotein B, homocysteine, ferritin and vitamins (total antioxidant capacity, folate, thiamin, riboflavin and vitamin B6).
Participants: Recruits on their first day of Army recruit training were invited to participate. Participants recording an implausible level of energy intake or who did not complete the questionnaire were excluded. The final sample included 107 (males= 91) for dietary survey and 184 (males= 159) for biochemistry tests.
Main outcome measures: Nutrient intake, food risk score, body mass index, biochemical vitamin status, cardio¬vascular disease risk factors.
Results: Recruits mostly had ideal body weight, had a high rate of smoking (26%) and high participation in organ-ised sports. The average diet was too high in fat and unbalanced with respect to the recommended core food groups. Recruits were at risk of eating insufficient calcium, magnesium and zinc and folate, thiamin and riboflavin deficiencies were revealed. Females were at risk of iron deficiency. Half had at least one risk factor for cardiovascular disease.
Conclusions: Nutrition education should aim to lower the prevalence of cardiovascular risk factors and address the special dietary needs of female personnel. Education strategies need to build an awareness of the association between lifestyle factors and increased risk of cardiovascular disease as well as improving the eating habits of personnel.
Keywords: Army recruits, military, risk factors, dietary intake, nutritional status
INTRODUCTION
THE US MILITARY is sufficiently concerned about modifiable cardiovascular (CV) risk factors amongst active-duty service personnel to have implemented nutrition and health promotion initiatives during the 1980’s’ and follow-up nutrition assessment programs 2 have shown the benefits of changes implemented in the service messes. Service personnel eating in messes are more likely to eat the recommended servings.
Medical Simulation Centre has developed expertise in medical simulation of fruit and vegetables than the general US population3 and over the past decade have reduced their fat intake and lowered their serum cholesterol P. Evaluation of US Navy health promotion efforts in two longitudinal cohort studies of life-style factors, an eight-year study (n = 640) and an eleven-year study (n = 1576), demonstrated a significant positive effect on fitness and health behaviours.
Recent information concerning the eating habits of ADF personnel is not available. However, during the 1980’s ADF personnel eating in barracks were apparently consuming excessive salt and fat. Problems identified at the time included a low rate of atten¬dance at messes, provision of food from commercial fast-food outlets and overconsumption of food by sedentary and active ADF members.
The ADF Health Status report identified the development of an ADF health promotion program with a focus on injury prevention, mental health and CV health as a priority activity’. The present study complements this activity by determining the adequacy of the dietary intake of Army recruits prior to commencing their training and highlighting problem areas, which may become the basis for future health promotion programs.
METHODS
Participants
During the period, March-May 1998, Army recruits arriving at Army recruit training centre (ARTC) were invited to take part in a health and diet survey. Approximately 184 recruits (159 males and 25 females) took part in the survey during their first day at the Kapooka Army Base. Most recruits (90%) were school-leavers aged between 17 and 25 years (range 17 to 36 years). Three recruits were university graduates and 13 had graduated from a college of higher education. Participants completed a health and diet questionnaire, had their weight and height recorded and donated a fasting blood sample. The questionnaire consisted of 15 demographic and medical questions and a 152-food semi-quantitative food frequency questionnaire (FFQ), which had been validated against a three-day food diary”. The experimental procedures were approved by the Australian Defence Medical Ethics Committee (ADMEC protocol133/97). Written consent was obtained from each participant after the details of the study were explained.
Biochemical analysis
Subjects fasted overnight. The next morning before breakfast a 25mL venous blood sample was drawn. Blood was processed within one hour of collection by centrifugation then washing and dilution of red blood cells into appropriately buffered solutions. Plasma and red blood cell samples were transported frozen to a central laboratory for analysis. Vitamin B6 (pyridoxal 5′-phosphate) and riboflavin status were assessed by use of automated functional enzyme methods9, red blood cell thiamin was measured by microbiological assay10, total plasma homocysteine was measured by High-Performance Liquid Chromatography method11 and total antioxidant capacity (TAOC) was measured by automated colorimetric assay using reagents supplied by Randox Laboratories, UK. Plasma lipids (cholesterol and triglycerides) were measured by automated enzymatic assays using manufacturer-supplied reagents (Roche Diagnostics, New Jersey, USA). High-density lipoprotein (HDL) cholesterol was measured by the same technique following precipitation of low-density lipoprotein (LDL) and very-low-density lipoprotein with polyethylene glycol. Ferritin and apolipoprotein B were measured by a particle-enhanced nephelometric assay using manufacturer-supplied reagents (Behring BNA, Dade Behring, Germany).
Data analysis
Nutrient intake was calculated using the DIET/1 NUTRIENT calculation software (Xyris Software, Brisbane, Australia), which used the NUTTAB 92 database, a database of Australian foods. This database does not include values for folates, vitamin B6 or vita¬min E. Participants with a ratio of energy intake to basal metabolic rate of less than 1.10 and those who completed the FFQ incorrectly were excluded from dietary data analysis.12 Individual food risk scores were calculated by comparing the individual’s intake of the food groups (fruit, vegetables, dairy products, meat and cereal products) against the ‘Core Food Groups’ of the National Health and Medical Research Council (NHMRC).13 A score of ‘0’ indicated that recommenda¬tions for all five groups were met and a score of ‘5’ indicated that no food-group recommendations were met.
Statistical analyses were performed with SPSS (Statistical Package for the Social Sciences, version 9.0, 1999, SPSS, Inc., Chicago, IL). Descriptive statis¬tics, including means, medians, standard deviations, 2.5th and 97. 5th percentiles were used to compare dietary intake with the recommended dietary intakes (RDI)14 and the National Nutrition Survey.15 These also allowed comparison between biochemical mea¬surements with clinical cut-offs. Where required, data were transformed (natural log) to normalise the distri¬butions. Significance was accepted at p < 0.05 and in regression analyses an r2 value0.25 with p < 0.05. Multiple linear and binomial logistic regression analy¬ses were used to assess associations between variables. Comparison of means was achieved by use of the independent to test and Levene’s test for equality of variances. The distribution of nutrient intakes below the RDI
was determined and combined with probabil¬ity statistics to calculate the number of subjects likely to have reported intakes below their individual requirements. This approach recognises that the RDI overestimates nutrient requirements of almost all individuals in the population.
RESULTS
Health questionnaire
The questionnaire revealed an apparently healthy group of young people with a high rate of smoking (26%) and high participation in organised sports (80%). Although 62% of recruits had more than two standard drinks in the week prior to the survey, the reported average daily intake of alcohol was 0.5 standard drinks. Vitamin or nutritional supplements were taken by 13% of recruits. The incidence of upper respiratory tract infection was 26% in the fortnight preceding the survey. The average body mass index of recruits was 21 (SD = 2, range 15 to 27) and only three recruits had a BMI > 25. Eighteen recruits (10%) reported a family history of heart disease.
Dietary intake
Figure 1: Summarises the overall dietary balance by presenting the distribution of food risk scores. Figures
2 and 3 present the mean intakes of vitamins and minerals, respectively.
Nutrient intake was not associated with age, gender, BMI, education nor any of the biochemistry measures. Table l compares the mean daily energy and nutrient intakes of recruits with the results from the 1995 National Nutrition Survey. Table 2 provides an estimate of the adequacy of micronutrient intake and Table 3 presents the mean dietary intake, by food groups, of the recruits. No associations were found between dietary intake and biochemical measurements.
FIGURE 1: Distribution of food risk scores (n=107).
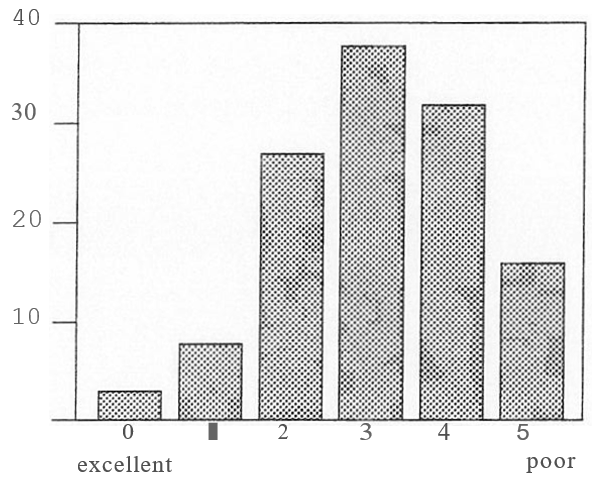
FIGURE 2: Mean and SD for daily intake of vitamins. The columns extend from 0 to the mean of the values and the bars represent the SD. Results are presented as a proportion of RDI. [RDI =recommended dietary intake.]
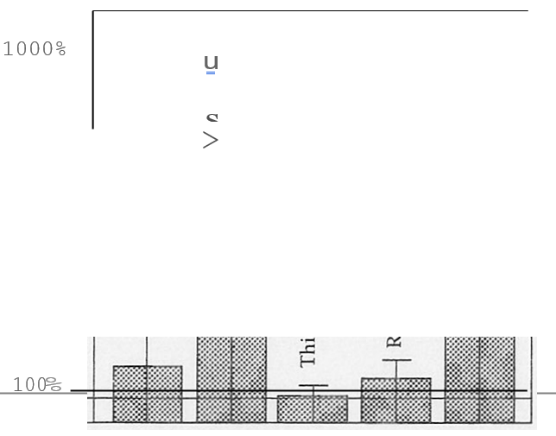
FIGURE 3: Mean and SD for daily intake of minerals. The columns extend from 0 to the mean of the values and the bars represent the SD. Results are presented as a proportion of RDI. [RDI =recommended dietary intake.]
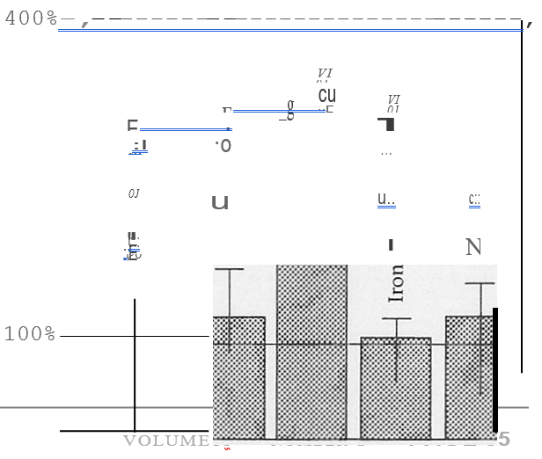
TABLE 1: Mean and SD for daily energy and nutrient intakes compared with the National Nutrition Survey and RDI. (*Males n = 91, females n = 16. Age range 17-36 yr, mean age 21 ± 3.5 yr. The data collected in the pre¬sent study was by use of a food frequency questionnaire and data collected by the National Nutrition Survey was by a 24-hour recall method. Data for the National Nutrition Survey are presented for all persons aged 19 and over with an energy intake to BMR ratio 0.9 and for all persons aged 19 to 24 years. [RDI =recommended dietary intake; El =energy intake; BMR =basal metabolic rare.1
| sex | Recruits* | National Nutrition Survey t | RDP’ | ||
|---|---|---|---|---|---|
| Aged 19 and over EI; ≥ 0.9 BMR |
Aged 19-24 | ||||
| Energy (MJ) | M | 12.0 ± 3.0 | 11.8 | 13.3 | 9.8- 11.2 |
| F | 10.2 ± 3.0 | 8.4 | 8.4 | 8.5- 9.7 | |
| Protein (g) | M | 127 ± 34 | 116 | 128 | 55 |
| F | 107 ± 29 | 81 | 78 | 45 | |
| Carbohydrate (g) | M | 321 ± 105 | 321 | 376 | |
| F | 289 ± 82 | 233 | 243 | ||
| Fat (g) | M | 116 ± 33 | 106 | 119 | |
| F | 93 ± 50 | 77 | 75 | ||
| Alcohol (g) | M | 6.3 ± 7.2 | 20 | 15 | |
| F | 3.7 ± 4.1 | 9 | 7 | ||
| Fibre (g) | M&F | 29 ± 12 | 25 | 23 | 30 |
| Magnesium (mg) | M | 423 ± 149 | 404 | 390 | 320 |
| F | 405 ± 157 | 310 | 273 | 270 | |
| Calcium (mg) | M&F | 1214 ± 498 | 919 | 929 | 800 |
| Iron (mg) | M | 18 ± 6 | 17 | 18 | 7 |
| F | 15 ± 5 | 13 | 12 | 14 | |
| Zinc (mg) | M&F | 16 ± 5 | 13 | 14 | 12 |
| Vitamin A (mg retinol equivalen ts) | M&F | 1413 ± 616 | 922 | 1065 | 750 |
| Vitamin C (mg) | M&F | 241 ± 198 | 102 | 135 | 40 |
| Thiamin (mg11000kj) | M&F | 0.21 ± 0.05 | 0.15 | 0.2 | 0.1 |
| Riboflavin (mg11000kj) | M&F | 0.30 ± 0.11 | 0.19 | 0.2 | 0.155 |
| Niacin (mg niacin equivalents/1000kj) | M&F | 4.72 ± 0.79 | 4.09 | 4.4 | 1.6 |
TABLE 2: Dietary assessment of micronutrient adequacy
| Nutrient | Sex | Mean Intake: RDI (%) | Proportion below RDI (%) | Probability Estimate of Inadequacy* (%) |
|---|---|---|---|---|
| Vitamin A equivalents | M&F | 188 | 9 | 3 |
| Thiamin | M&F | 209 | 0 | 0 |
| Riboflavin | M&F | 197 | 4 | 1 |
| Niacin equivalents | M&F | 295 | 0 | 0 |
| Vitamin C | M&F | 602 | 2 | 1 |
| Calcium | M&F | 152 | 18 | 10 |
| Magnesium | M | 132 | 26 | 7 |
| F | 150 | 19 | 10 | |
| Iron | M | 254 | 0 | 0 |
| F | 110 | 50 | 19 | |
| Zinc | M&F | 136 | 19 | 6 |
TABLE 3: Mean daily dietary intakes for food group*. (*Food group intakes are expressed as number of serves. Serving size is indicated in parentheses).
| Food group | Mean | Median | SD | Minimum | Maximum |
|---|---|---|---|---|---|
| Alcoholic beverage (10g ethanol) | 0.5 | 0.4 | 0.56.56 | 0.01 | 3.7 |
| Non-alcoholic beverages (100 mL) | 6.9 | 6.0 | 3.9 | 1.4 | 20.0 |
| Cereals (1/2 cup raw, 2 slices, 2 biscuits) | 4.9 | 4.3 | 2.7 | 1.9 | 22.5 |
| Dairy (250 mL milk, 30 g cheese) | 2.8 | 2.4 | 1.6 | 0.1 | 8.1 |
| Egg. (1 whole) | 0.3 | 0.3 | 0.36 | 0 | 3 |
| Oils & butter (1 tablespoon) | 1.3 | 1.1 | 1.0 | 0.02 | 6.6 |
| Fish (120 g) | 0.27 | 0.12 | 0.28 | 0 | 1.7 |
| Fruit (1 whole, 2 small) | 1.7 | 1.4 | 4.5 | 0 | 8.4 |
| Fruit juice (250 mL) | 1.0 | 0.57 | 1.4 | 0 | 8.0 |
| Pulses (112 cup) | 0.2 | 0.01 | 0.26 | 0 | 1.3 |
| Meat (120 g, 1/4 chicken) | 1.9 | 1.8 | 0.9 | 0.2 | 5.1 |
| Nuts (1/2 cup) | 0.24 | 0.13 | 0.27 | 0 | 1.3 |
| Confectionery (50 g bar) | 0.53 | 0.36 | 0.59 | .03 | 4.2 |
| Vegetables (l/2 cup) | 5.1 | 4.7 | 2.8 | 0.4 | 16.6 |
Biochemistry measures
Table 4 presents the mean results for the biochemistry measures compared with clinical cut-offs. Apart from plasma ferritin where females had lower values (t = 4.836, p<0.01), males and females had similar results for all measurements. When the Army recruits were compared with a group of blood donors of similar age17 (mean= 23.1 ± 3.8 yr., 388 males and 491 females), the recruits (mean = 21 ± 3.5 yr., 91 males and 16 females) had poorer thiamin (t = 4.325, p < 0.01) and riboflavin (t = 7.385, p < 0.01) status and better vitamin B-6 status (t = 10.304, p < 0.01). No associations were found between age and biochemical measurements.
TABLE 4: Biochemical assessment of nutrient adequacy.
(* Of the 8 participants with low plasma ferritin concentrations, 4 were female. TAOC = total antioxidant capacity; HDL = high-density lipoprotein; LDL =low-density lipoprotein; EGRAC = erythrocyte glutathione reductase activity coefficient, a functional measure of riboflavin status; EASTAC = erythrocyte aspartate transaminase activity coefficient, a functional measure of vitamin B6 status.)
| Proportion outside clinical range (% n) | |||
|---|---|---|---|
| TAOC (mmo1!L) | 1.71± 0.19 | ≥1.60 | 28.6%, 52 |
| Total Cholesterol (mmo1!L) | 4.5 ± 1.03 | ≤5.2 | 24.6%, 45 |
| Triglycerides (mmo1!L) | 1.02 ± 0.40 | ≤1.30 | 9.8%, 18 |
| HDL-Cholesterol (mmo1!L) | 1.08 ± 0.28 | ≥0.9 | 2.2%, 4 |
| LDL-Cholesterol (mmo1!L) | 2.99 ± 0.93 | ≤3.50 | 24%, 44 |
| Apolipoprotein B (giL) | 1.05 ± 0.31 | ≤1.30 | 19%, 35 |
| Apolipoprotein B:LDL-C | 0.23 ± 0.05 | <0.26 | 30%, 55 |
| Ferritin (giL) | 80.2 ± 56.1 | >15.0 | 4.4%, 8* |
| Total Homocysteine (mmo1!L) | 13.5 ± 11.5 | <10.0 | 55.7%, 101 |
| Red Cell Thiamin (nmo1!L) | 283 ± 97 | ≥190 | 13.2%, 24 |
| EGRAC (i.e. riboflavin) | 26.1 ± 16.6 | ≤40 | 17%, 31 |
| EASTAC (i.e. Vitamin B6) | 74.9 ±21.1 | ≤120 | 0 |
DISCUSSION
The average daily diet of the recruits provided 12000 kj (males) and 10000 kj (females) as protein (18%), carbohydrate (44%), fat (36.5%) and alcohol (1.5%). This represents an average diet, which is too high in fat according to the National Goals and Targets for Improving Health.18 Figure 1 shows that the recruits’ diet is biased towards an unbalanced eating pattern. Although the recruits were at low risk of eating insuf¬ficient vitamins, riboflavin, thiamin and folate defi¬ciencies were identified. The Army recruits may have had worse thiamin and riboflavin status than a group of their peers from the general Australian population. Some recruits (male and female) were at risk of eating insufficient calcium (10%), magnesium (10%), and zinc (6%) and females were at risk of eating insuffi¬cient iron (19%).
The dietary intake of the recruits was compared with the dietary intake of adults of the same age recorded during the 1995 National Dietary Survey. Although the National Dietary Survey provides insufficient data to allow statistical comparison and the two surveys used different dietary assessment tools, some observations can be made. The energy and macronutrient intakes (protein, carbohydrate, fat) of recruits appears similar to the general public, their intake of vitamins and minerals might be higher and their alcohol consumption might be lower than the general public. This is potentially positive because it suggests that the recruits eat better than the general public. Such a finding is consistent with this group (recruits) being selected for their high level of physical fitness and good body mass index.
Thiamin has been considered to be one of the marginally adequate nutrients in the Australian diet. It was believed that thiamin enrichment of flour to the concentration of 6.4 mg1kg, which commenced in 1991, would alleviate the problem of poor thiamin status in the Australian population.19 However, the finding of the significant prevalence of thiamin deficiency amongst first-time blood donors17 and Army recruits suggests that the benefit of this public health measure requires reassessment.
One in four female recruits had reduced iron stores. This finding, coupled with the apparently poor dietary intake of iron by female recruits, suggests that female soldiers are at risk of iron deficiency. This comes as no surprise, because a 1995 review of iron status in Australia identified teen-aged girls and women of child-bearing years as having high rates of iron deficiency.
The antioxidant status of 29% of recruits was shown to be less than optimal. Evidence is accumulating that oxidative stress contributes to the pathogenesis of chronic diseases such as atherosclerosis and that it
slows recovery from a period of vigorous physical activ¬ity. Because it is difficult to isolate the individual contributions of the various antioxidant systems in the body, the measurement of the total antioxidant capacity (TAOC) may be the most relevant measurement to assess antioxidant status. A lower than normal TAOC can therefore result from either a primary reduction in antioxidant resistance or a secondary reduction as a result of increased antioxidant stress. The method used in the present study is influenced by urate, albumin, ascorbate, glutathione, vitamin E and bilirubin. One criticism of the method concerns the non-stoichiomet¬ric response of the assay to the different antioxidants.21 A further problem is that of defining an appropriate clinical cut-off. Our laboratory has not established an optimal reference interval for the assay. In the present study a manufacturer’s reference has been used.
Possibly the most important finding concerns folate status. Elevated homocysteine, which has been identi¬fied as an independent risk factor for peripheral, cere¬bral and coronary vascular disease, is inversely related to folate status. Moderately elevated homocysteine concentrations may be the first biochemical marker of insufficient intracellular folate. Recent studies suggest that the cut-off for a healthy plasma homocysteine concentration (i.e. minimal risk for CV disease) may fall below 10-15 mmoVL. 22 More than half (56%) of recruits had homocysteine values > 10 mmoVL.
Apart from elevated homocysteine, additional CV risk factors were identified amongst the recruits. One in four had elevated cholesterol, 19% had elevated apolipoprotein B and 10% had elevated triglyceride concentration. Of these results, apolipoprotein B is possibly the best predictor of risk. A predominance of small, dense LDL (LDL-III) in plasma is predictive of coronary risk 23 and the concentration of apolipopro¬tein B tends to increase with increased concentration of LDL particles. The ratio of apolipoprotein B to LDL-cholesterol provides an estimate of the absolute number of LDL particles, which is known to be an independent risk factor for coronary heart disease.
Elevated fasting plasma triglyceride concentration (>1.5 mmol/L) in the presence of elevated apolipoprotein B to LDL-cholesterol ratio (>0.26) is highly predictive of the presence of small dense LDL particles,… Five per cent of recruits had both elevated plasma triglyceride concentration and elevated apolipoprotein B to LDL-cholesterol ratio.
The estimated dietary intake of foods and nutrients by recruits did not predict the apparent prevalence of vitamin deficiency and CV risk factors. This is not unexpected because the FFQ tool is best used to identify trends in eating patterns rather than individual nutrient intakes. The lack of correlation between estimated dietary intake and biochemical measures highlights the need to include blood tests as part of nutritional status monitoring. Moreover, non-dietary factors such as cigarette smoking and level of physical activity may be contributing to the observed biochem¬ical status.
The authors recommend that nutrition education be targeted at lowering the prevalence of CV risk factors among Army personnel and addressing the special dietary needs of female personnel. Education strategies need to build an awareness of the association between lifestyle factors and increased risk of CV disease as well as improving the eating habits of personnel. Furthermore, it is recommended that a uniform through-career approach to nutrition education should be adopted at Defence policy level and that such a program should be routinely monitored by use of surveys such as that reported here.
ACKNOWLEDGEMENTS
The authors would like to thank the staff at Defence Nutrition, who provided assistance with data entry, chemical analyses and project administration. In particular, we wish to thank our project team members, Chris Forbes-Ewan, Tracey McLaughlin and Gary Thomson for many useful discussions concerning the research direction.
DECLARATION
There was no conflict of interest with respect the conduct of this survey. This survey was sponsored by Defence Health Services and funded by the Department of Defence in accordance with the Defence Science and Technology Organisation’s research tasking process. The sponsor had no involvement in the conduct of the survey, nor gave direction regarding the publication of the report. DSTO management authorisation was required before the manuscript could be submitted for publication.