
Abstract
Purpose: A better understanding of demand behaviours regarding dental services can help oral health planning for military personnel and their families. The objective of this study was to investigate the socio-economic factors affecting the demand for dental services among the military-sector-affiliated families (MSAFs).
Methods: The present study was cross-sectional descriptive-analytical research conducted in Tehran metropolis in 2019. The sample size was 385 heads of MSAFs selected using the multiple-stage method (stratified- clustering). The study questionnaire was designed according to the conceptual research model. Ten experts assessed its face and content validity using CVI and CVR indices. Reliability was measured by Cronbach’s alpha coefficient, which was 0.82. Four hundred participants took part in filling on the questionnaire. All analyses performed using SPSS 16 and the logistic regression model.
Results: Findings of the present study showed that more than 21% of people required dental services but did not actually demand these services. Although people living in the south of Tehran metropolis felt more in need of dental services (OR: 3.63, P = 0.063), the potential of demand for dental services among them was significantly lower than people living in the centre (OR: 0.25, P = 0.049).
Conclusion: There were statistically significant geographical inequalities in the need and demand for dental services among the MSAFs. Measures should be taken to provide active dental screening according to the socio-economic status of military families in Tehran.
Introduction
Determining socio-economic factors affecting disease has an important role in promoting the health of individuals and society as a whole, and is considered a basic human right today.1 Socio-economic status can be deemed one of the main causes of major health issues; therefore, factors influencing social health might account for the emerging features of inequalities in any national health system.2 Therefore, the World Health Organization pays special attention to addressing health inequalities and identifying the underlying socio-economic causes, especially in low and middle-income countries (LMICs). However, there is a lack of research on health topics in these countries, so it is of great concern to investigate household health conditions, determine and analyse their related socio-economic determinants for better comprehensive understanding.3,4
One of these major health problems is oral and dental health, which affect individual and social activities, labour force engagement and mental health.5 According to the literature, dental problems have a profound effect on the quality of life.5,6 It is also associated with other chronic medical diseases,7 in addition to functional, social and psychological constraints.8 Drawing on the results of the Harford and Chrisopoulos study in Australia, the average estimated financial loss in labour productivity as a result of oral health problems was 453 million USD per year, and the average working hours lost per worker was 1.56.9 In addition, dental health reports from the United States revealed that there is a correlation between oral and dental diseases and cardiovascular consequences, respiratory infections and pregnancy problems including premature and low weight births.10
Oral and dental diseases are asymptomatic in the early stages and characterised by slow progression; thereby, they can be diagnosed and easily treated through regular and periodic check-ups in the early stages.10 Given the treatment costs, a significant reduction in future costs can be achieved by timely referral and prompt demand for such care.11 However, the shortage in health insurance coverage for dental services, the economic inflation and financial hardship, and increased dental services costs have a greater impact on the access to these services, especially for poor and low-income groups in developing countries. The most important barriers to access oral and dental health services in such countries include scarcity of financial resources, increased medical expenses and long distances to medical centres.12-14 Consequently, the accessibility of individuals and households to oral and dental health services should be constantly monitored. In addition, the underlying factors affecting the utilisation of these services have to be identified and evaluated.
As one of the LMICs, the social and economic inequalities arising in the use of dental services in Iran have not received the necessary interest in terms of research; therefore, few studies are available in this regard.15 Reasons such as cultural, moral and religious differences, and the range of diseases have made patient referrals and demand on dental services complex and extensive.16 Hence, there is a pressing need to further examine the socio-economic context influencing the demand for dental services.
Depending on research in the fields of epidemiology and health economics, socio-economic factors have been conventionally defined in accordance with three main criteria; income, education and employment.17 Previous studies on dental services showed that other factors could be added to the three criteria due to direct and indirect effects. These factors encompass anxiety, fear, medical records, waiting time, availability, insurance coverage and out-of- pocket payment can be listed as prerequisites for the need and demand for dental services.18
As one of the largest cities in the world, Tehran, the capital of Iran, has a large population. This has led to profound variations between household living standards in terms of social, economic and cultural conditions.19 The diversity among Tehrani inhabitants represents a good opportunity for researchers to assess and identify socio-economic factors affecting oral and dental health. To the best of our knowledge, no study has been conducted on the behaviour towards dental services among the military-sector-affiliated families (MSAFs). In Iran, the Armed Forces Medical Service Insurance Organization (AFMIO) presents a health insurance program for military members, their dependents, veterans, retirees and some survivors. The AFMIO also provides compulsory dental insurance to MSAFs. All MSAFs are covered under this dental insurance. MSAFs are free to use military dental centres or under-contract private centres; part of the charges will be financed by the AFMIO. This study aimed to investigate the socio-economic factors affecting the demand for dental services among MSAFs. It could help better understand customers’ behaviour in the dental services sector and provide guidelines for essential oral and dental health planning for the MSAFs.
Oral health is an important issue for military personnel and their families. However, there is still little knowledge about the behaviour of MSAFs for dental services from the perspective of health economics. A correct explanation of dental demand function can make it possible to analyse the demand elasticity of dental health services, leading to more adaptation of services provided to the expectations of military personnel and their families. The specific characteristics of dental services, such as the effectiveness of preventive measures, non-emergency and individual-based decision making for visiting and receiving services, justify economic studies of these services, especially of consumption behaviour of MSAFs in both dimensions of need and demand based on the population-based approach. In this study, in addition to the three main socio-economic variables affecting the consumption behaviour of dental services, the variables of anxiety and fear were studied for the first time in the demand function estimation approach.
Methods
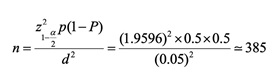
The present study is cross-sectional descriptive- analytical research that was conducted in 2019. The study population consists of all the heads in the MSAFs who had at least one year of permanent residence in one of the 22 urban districts of Tehran city. MSAFs have been defined as the immediate family members related by blood, marriage or adoption to a person of the armed forces (employing or retired), including the spouse/partner, children and father/mother living with them. Three hundred eighty-five participants were recruited to take part in this study. The sample size was calculated based on the formula shown below at P=50%, 95% confidence level (α = 0.05) and error (d = 0.05).
Due to the lack of access to information of MSAFs in Tehran, sampling was performed using a multiple- stage method (stratified-clustering). For this purpose, the 22 districts in Tehran were divided into five general districts; north, south, centre, east and west (as strata). Afterwards, the Etka stores (affiliated with the Iranian Armed Forces) in Tehran were identified according to the five districts, and one store was randomly selected in each area to form the sample (as a cluster). Finally, 80 heads of family referring to each of these stores were voluntarily and randomly selected to participate in filling in the questionnaire.
The present research was performed in three phases. In the first phase, the main variables affecting the utilisation of dental services were identified by reviewing the relevant literature. These variables include demographic factors (age, sex, household size, marital status and race/ethnicity), traditional socio-economic factors (occupation status, income and education level) and complementary factors (anxiety, fear, waiting time, access (place of residence), insurance coverage and the service price).18 Some factors were excluded, which are less common and also those similar among the population, including insurance type, service price and race. In the second stage, a preliminary questionnaire was prepared and psychometrically evaluated according to the variables presented in the conceptual research model. For this aim, face and content validity of the questionnaire were assessed using CVI (Content Validity Index) and CVR (Content Validity Rate) indices by 10 experts. The CVI index ranged from 1 to 0.08, and the CVR index ranged from 1 to 0.6, which were accepted as the minimum scores for each group. Then, the questionnaire reliability was measured using Cronbach’s alpha coefficient, which was achieved at 0.82 based on the data collected in the pilot study included 40 heads of family in one of the Etka stores. The customised questionnaire consisted of 4 parts, and a total of 44 items. The first part (3 items) was related to the demand for dental services, and the second part (4 items on a Likert scale) was on anxiety, while the third part included (19 10-point items) on fear. The fourth part was related to the sociodemographic and economic information about the head of the family (18 questions). The 3 items of the first part of the questionnaire are details as follows. The first item was considered in the form of a table and items A, B and C, which include: A) The need of family head and each member to dental services during the past year (closed question with yes and no answer); B) Referring and receiving dental services by family head and each member during the past year (closed question with yes and no answer); and C) Type of dental services received (closed question), co-payment (open question), place of service (closed question),basic and supplementary insurance coverage (closed question) and the number of referrals for receiving dental services (open question). The second item considered the cost of paying for travel to the medical centre (open question). The third item considered the average waiting time to receive the service in the medical centre (open question). Waiting time was defined as the time spent by subjects in the waiting room at their last dental visit.
In the final stage, after confirming the questionnaire in terms of psychometrics and reliability, the necessary permissions were obtained to refer to Etka stores to collect data by coordinating with the relevant centres. In addition, informed consent was obtained from the participants provided with guidance and explanations illustrating the aim and purpose of the study. The questionnaire was completed by the head of the MSAFs. Sampling was carried out during weekdays and mostly in the evening due to peak store visitors. This continued up to meeting the sufficient samples size. To get the required number of valid questionnaires, 400 were distributed and completed by the heads of families.
Using SPSS version 16, data were analysed descriptively and by applying logistic regression models were used to estimate the factors affecting the demand for dental services. Moreover, the ethical approval for the study had been obtained from the Research Ethics Committee of Baqiyatallah University of Medical Sciences.
Results
Table 1 shows the sociodemographic data of the participants in the study. According to the findings, 70% of the participants (281) in the last year required dental services; however, 21% (61 participants) of them did not visit a medical centre to receive these services. The highest non-referral rates were related to males (22%), married (23%), diploma and degree holders (35%), employed (22%), residents in southern Tehran (53%), their average age was 40.9±8 years, the average income of 816.93 US$ per month and the average family size was 3.5 individual in the household.
Table 2 illustrates the complementary variables in the study. Based on the results, the highest non-referral rate was related to participants who experienced mild anxiety (≈ 24%), followed by moderate anxiety (≈ 21%), then severe anxiety (12.5%). Regarding the degree of fear, the highest rate of non-referral belonged to the group that experienced moderate fear (25.2%). Moreover, the participants who visited the dental clinic and received their services have waited for about 76.34±53.43 minutes, while those who did not receive have waited for 107±71.9 minutes in their last refer.
Table 1. Demographic and classical variables studied in the research
| Variables | Need-based dental services (Need for treatment) | Demand-based dental services (Attendance for treatment) | ||||||
| Yes | No | Total | Yes | No | Total | |||
| Sex | Female | N(%) | 24(68.60) | 11(31.40) | 35(100) | 21(87.50) | 3(12.5) | 24(100) |
| Male | N(%) | 257(70.40) | 108(29.60) | 365(100) | 199(77.40) | 58(22.60) | 257(100) | |
| Total | N(%) | 281(70.30) | 119(29.80) | 400(100) | 220(78.30) | 61(21.70) | 281(100) | |
| Marital status | Single | N(%) | 20(52.60) | 18(47.40) | 38(100) | 19(95) | 1(5) | 20(100) |
| Married | N(%) | 247(71.80) | 97(28.20) | 344(100) | 188(76.10) | 59(23.90) | 247(100) | |
| Death of a spouse | N(%) | 8(66.70) | 4(33.30) | 12(100) | 7(87.50) | 1(12.50) | 8(100) | |
| Divorced | N(%) | 6(100) | 0(0) | 6(100) | 6(100) | 0(0) | 6(100) | |
| Total | N(%) | 281(70.30) | 119(29.80) | 400(100) | 220(78.30) | 61(21.70) | 281(100) | |
| Education level | High school | N(%) | 12(44.40) | 15(55.60) | 27(100) | 10(83.30) | 2(16.70) | 12(100) |
| Diploma | N(%) | 45(72.60) | 17(27.40) | 62(100) | 29(64.40) | 16(35.60) | 45(100) | |
| Above diploma | N(%) | 50(64.10) | 28(35.90) | 78(100) | 34(68) | 16(32) | 50(100) | |
| BSc | N(%) | 94(66.70) | 47(33.30) | 141(100) | 79(84) | 15(16) | 94(100) | |
| MSc | N(%) | 60(85.70) | 10(14.30) | 70(100) | 48(80) | 12(20) | 60(100) | |
| PhD | N(%) | 20(90.90) | 2(9.10) | 22(100) | 20(100) | 0(0) | 20(100) | |
| Total | N(%) | 281(70.30) | 119(29.80) | 400(100) | 220(78.30) | 61(21.70) | 281(100) | |
| Employment status | Employed | N(%) | 246(72.80) | 92(27.20) | 338(100) | 192(78) | 54(22) | 246(100) |
| Retired | N(%) | 35(56.50) | 27(43.50) | 62(100) | 28(80) | 7(20) | 35(100) | |
| Total | N(%) | 281(70.30) | 119(29.80) | 400(100) | 220(78.30) | 61(21.70) | 281(100) | |
| Place of residence | North | N(%) | 40(87) | 6(13) | 46(100) | 34(85) | 6(15) | 40(100) |
| South | N(%) | 13(81.30) | 3(18.80) | 16(100) | 6(46.20) | 7(53.80) | 13(100) | |
| West | N(%) | 37(54.40) | 31(45.60) | 68(100) | 32(86.50) | 5(13.50) | 37(100) | |
| East | N(%) | 160(75.10) | 53(24.90) | 213(100) | 124(77.50) | 36(22.50) | 160(100) | |
| Centre | N(%) | 31(54.40) | 26(45.60) | 57(100) | 24(77.40) | 7(22.60) | 31(100) | |
| Total | N(%) | 281(70.30) | 119(29.80) | 400(100) | 220(78.30) | 61(21.70) | 281(100) | |
| Age | N | person | 281 | 119 | 400 | 220 | 61 | 281 |
| Mean | Year | 40.54 | 41.37 | – | 40.42 | 40.95 | – | |
| SD | Year | ±9.36 | ±13.26 | – | ±9.60 | ±8.50 | – | |
| Household size | N | person | 281 | 119 | 400 | 220 | 61 | 281 |
| Mean | person | 3.46 | 3.06 | – | 3.44 | 3.56 | – | |
| SD | person | ±1.21 | ±1.25 | – | ±1.24 | ±1.10 | – | |
| Income | N | person | 281 | 119 | 400 | 220 | 61 | 281 |
| Mean | US$1 | 897.94$ | 791.11$ | – | 920.40$ | 816.93$ | – | |
| SD | US$ | ±34.8 | ±28.5 | – | ±37.03 | ±23.8 | – | |
Table 2. Complementary variables in the study
| Variables | Need-based dental services (Need for treatment) | Demand-based dental services (Attendance for treatment) | ||||||
| Yes | No | Total | Yes | No | Total | |||
| Anxiety | Mild | N(%) | 163(67.10) | 80(32.90) | 243(100) | 124(76.10) | 39(23.90) | 163(100) |
| Moderate | N(%) | 86(73.50) | 31(26.50) | 117(100) | 68(79.10) | 18(20.90) | 86(100) | |
| Severe | N(%) | 32(80) | 8(20) | 40(100) | 28(87.50) | 4(12.50) | 32(100) | |
| Total | N(%) | 281(70.30) | 119(29.80) | 400(100) | 220(78.30) | 61(21.70) | 281(100) | |
| Fear | Low | N(%) | 127(64.80) | 69(35.20) | 196(100) | 103(81.10) | 24(18.90) | 127(100) |
| Moderate | N(%) | 123(74.10) | 43(25.90) | 166(100) | 92(74.80) | 31(25.20) | 123(100) | |
| High | N(%) | 31(81.60) | 7(18.40) | 38(100) | 25(80.60) | 6(19.40) | 31(100) | |
| Total | N(%) | 281(70.30) | 119(29.80) | 400(100) | 220(78.30) | 61(21.70) | 281(100) | |
| Waiting Time | N | person | 281 | 119 | 400 | 220 | 61 | 281 |
| Mean | Minute | 83.02 | 72.35 | – | 76.34 | 107.13 | – | |
| SD | Minute | ±59.19 | ±54.04 | – | ±53.43 | ±71.92 | – | |
Table 3 shows the logistic regression model results of the factors affecting the need for dental services. Based on the findings, there were some statistically significant differences in terms of the need for dental services between different socio-economic groups. The need for dental services of PhD holders was higher than others regarding their educational level. This difference was statistically significant when compared with high school, above diploma and BSc degree holders. Employed participants reported a decrease in their need for dental services than retired ones, and this difference was also statistically significant (OR: 2.06, P = 0.011). Also, the need for dental services among the residents of the north (OR:5.59, P = 0.001), south (OR:3.63, P = 0.063) and east (OR:2.53, P = 0.003) of the city were significantly higher than those residents in the city centre, respectively. Furthermore, those people who have experienced high fear demonstrated a need for dental services more than those in the group of low fear. (OR:2.41, P = 0.048). Increased waiting time and household size increased the likelihood of the need for dental services (OR: 1.00, 1.32, P < 0.1).
Table 4 illustrates the logistic regression model results of the factors affecting the demand for dental services. According to the obtained results, the place of residence was the only socio-economic factor that had a considered effect. The residents in southern Tehran reported less demand for dental services than those in the centre; this difference was statistically significant (OR: 0.25, P = 0.049). In addition, the odds of the residents in the north, west and east of Tehran demanding dental services was 1.6, 1.8 and 1.01 times higher than that of the residents in Tehran centre; however, this difference was not statistically significant.
Discussion
This study was conducted to estimate the demand for dental services among the MSAFs in Tehran city. Based on the sampling method, the number of selected subjects in each Etka store (north, south, east, west and centre) was equally selected to achieve a residence in all regions of Tehran city. However, the final distribution of the selected samples was asymmetrical in the residential area (north 12%, south 4%, east 53%, west 17% and centre 14%) because the MSAFs were completely free to refer to any Etka stores (it is not compulsory for them to refer to their living area shopping centres). Another noteworthy point is that Tehran’s military settlements and medical centres are mainly located in its eastern region, so the ratio of relevant samples in the eastern category has been more than other categories, demonstrating MSAFs geographical density.
The present study’s findings show that more than 21% of people required dental services but did not refer to receive these services. The highest non- referral rates were related to men (22%), married people (23%), diploma group (35%), employed group (22%) and residents of the south of Tehran (53%).
Table 3. Logistic regression results of factors affecting the need for dental services
| Variable / response variable: need | Coef | Std. Error | Sig. | OR | 95% CI | ||
| Lower | Upper | ||||||
| Sex (Ref:Female) | Male | -0.087 | 0.38 | 0.820 | 0.92 | 0.43 | 1.94 |
| Marital status (Ref: Single) | Married | -21.097 | 16407.93 | 0.999 | 0.0000000007 | – | – |
| Death of a spouse | -20.268 | 16407.93 | 0.999 | 0.0000000016 | – | – | |
| Divorced | -20.510 | 16407.93 | 0.999 | 0.0000000012 | – | – | |
| Education level(Ref: PhD) | High school | -2.526 | 0.84 | 0.003 | 0.08 | 0.02 | 0.41 |
| Diploma | -1.329 | 0.79 | 0.094 | 0.27 | 0.06 | 1.26 | |
| Above diploma | -1.723 | 0.78 | 0.027 | 0.18 | 0.04 | 0.82 | |
| BSc | -1.609 | 0.76 | 0.035 | 0.20 | 0.05 | 0.89 | |
| MSc | -0.511 | 0.86 | 0.532 | 0.60 | 0.12 | 2.97 | |
| Employment status (Ref: Retired) | Employed | 0.724 | 0.28 | 0.011 | 2.06 | 1.18 | 3.60 |
| Place of residence(Ref: Centre) | North | 1.721 | 0.51 | 0.001 | 5.59 | 2.05 | 15.26 |
| South | 1.290 | 0.69 | 0.063 | 3.63 | 0.93 | 14.15 | |
| West | 0.001 | 0.36 | 0.998 | 1.00 | 0.49 | 2.03 | |
| East | 0.929 | 0.31 | 0.003 | 2.53 | 1.38 | 4.65 | |
| Anxiety( Ref: Mild) | Moderate | 0.309 | 0.25 | 0.217 | 1.36 | 0.83 | 2.22 |
| Severe | 0.675 | 0.42 | 0.107 | 1.96 | 0.87 | 4.46 | |
| Fear(Ref: Low) | Moderate | 0.441 | 0.23 | 0.057 | 1.55 | 0.99 | 2.45 |
| High | 0.878 | 0.44 | 0.048 | 2.41 | 1.01 | 5.75 | |
| Waiting time | 0.003 | 0.00 | 0.093 | 1.00 | 1.00 | 1.01 | |
| Age | -0.007 | 0.01 | 0.475 | 0.99 | 0.97 | 1.01 | |
| Household size | 0.275 | 0.09 | 0.003 | 1.32 | 1.10 | 1.58 | |
| Income | 0.000000273 | 0.00000009 | 0.999 | 1.00 | 1.00 | 1.00 | |
According to the results of previous studies, the delay in timely demand on dental services in Iran has led to the rise of tooth extraction as a treatment strategy, followed by dental prostheses during the 40 and 50 age groups.20,21 Although almost all teeth are kept healthy between the ages between 35 and 40 years in developed countries, unfortunately, the average age of those with healthy teeth among Iranians is around 21 to 21.7 years old based on the statistics of the Oral Health Department in the Ministry of Health.22
The findings demonstrate the need for dental services in the PhD group was significantly higher than the high school (OR: 0.08, P = 0.003), diploma (OR: 0.27, P = 0.094), above diploma (OR: 0.18, P = 0.027) and BSc degrees (OR: 0.20, P = 0.035). These findings were consistent with preceding studies in the literature that revealed lower education levels and consequent lack of enough health information account for 60% of the differences in social groups in the volume and severity of disorders and diseases.23 Studies by Lee and Brown showed that higher levels of education are associated with better utilisation of dental services.24,25
Table 4. Logistic regression results of factors affecting the demand for dental services
| Variable / response variable: demand | Coef. | Std. Error | Sig. | OR | 95% CI | ||
| Lower | Upper | ||||||
| Sex (Ref:Female) | Male | 0.71 | 0.64 | 0.261 | 2.04 | 0.59 | 7.08 |
| Marital status(Ref: Single) | Married | -18.258 | 5.81 | 0.999 | 0.000000012 | – | – |
| Death of a spouse | -20.044 | 6.07 | 0.999 | 0.000000002 | – | – | |
| Divorced | -19.257 | 4.00 | 0.999 | 0.000000004 | – | – | |
| Education level (Ref: PhD) | High school | -19.593 | 0.84 | 0.998 | 0.000000003 | – | – |
| Diploma | -20.608 | 0.87 | 0.998 | 0.000000001 | – | – | |
| Above diploma | -20.449 | 0.89 | 0.998 | 0.000000001 | – | – | |
| BSc | -19.542 | 0.61 | 0.998 | 0.000000003 | – | – | |
| MSc | -19.817 | 0.37 | 0.998 | 0.000000002 | – | – | |
| Employment status (Ref: Retired) | Employed | -0.12 | 0.45 | 0.793 | 0.89 | 0.37 | 2.15 |
| Place of residence ( Ref: Centre) | North | 0.50 | 0.62 | 0.415 | 1.65 | 0.49 | 5.54 |
| South | -1.39 | 0.70 | 0.049 | 0.25 | 0.06 | 0.99 | |
| West | 0.62 | 0.65 | 0.333 | 1.87 | 0.53 | 6.61 | |
| East | 0.01 | 0.47 | 0.992 | 1.01 | 0.40 | 2.52 | |
| Anxiety(Ref: Mild) | Moderate | 0.17 | 0.32 | 0.593 | 1.19 | 0.63 | 2.24 |
| Severe | 0.79 | 0.57 | 0.163 | 2.20 | 0.73 | 6.67 | |
| Fear(Ref: Low) | Moderate | 0.03 | 0.51 | 0.954 | 1.03 | 0.38 | 2.79 |
| High | -0.34 | 0.50 | 0.497 | 0.71 | 0.27 | 1.90 | |
| Waiting time | -.008 | 0.01 | 0.490 | 0.99 | 0.98 | 1.01 | |
| Age | -0.006 | 0.02 | 0.696 | 0.99 | 0.97 | 1.02 | |
| Household size | -0.082 | 0.12 | 0.490 | 0.92 | 0.73 | 1.16 | |
| Income | 0.00000025 | 0.00000012 | 0.998 | 1.00 | 1.00 | 1.00 | |
Additionally, Thumboo et al. found that the score of physical and mental health submeasures increased by 0.6 to 0.5 points per each additional academic year.26 Howlader, Kiuila and Mieszkowski reported a strong relationship between education and health status, and there was a remarkable influence of education on health status mentioned in Pedrick study.27-29 In a study conducted in China, Ma and McGhee reported a positive and significant relationship between the level of education and increasing the quality of life score in terms of physical and mental health.30 Furthermore, a local study on the Iran provinces carried out by Vahdaninia showed that less-educated people had a poor health status when compared with well-educated ones.31
The results of the present study showed that the need for dental services in employees was significantly higher than retired (OR: 2.06, P = 0.011). This means that employed people feel their need for dental services 2.06 times more than retired people. This significant difference can be attributed to their higher sensitivity to their needs for oral and dental care, importance of their good appearance among colleagues in the workplace, and the more elasticity to dental services costs they enjoy. According to Bonakdarchian et al., the rootlessness level is reported much lower in employees than retirees, which could be the reason for the sense of need, consequently, more referral and receiving dental services.32 In the same vein, housewives and the unemployed pay less attention to their health compared to employees, according to Vahdaninia’s study.31 Asfar et al. and McFaden conducted two studies in Syria and the United Kingdom, respectively and demonstrated that unemployment was a predictive factor in assessing individuals lower level of health.33,34 Ma and McGhee’s research also displayed that employment in specialised occupations has a positive and significant relationship with an individual’s assessment of better physical and mental health status compared to simple occupations and unemployment.30 Investigating the social factors affecting health indicates that education, income and employment, are the three main variables in determining the socio-economic conditions of individuals.17 Meanwhile, employment, the most important factor in determining the level of income, can significantly impact the health status of the individual as well as society. On the other hand, employment is usually positively associated with health insurance coverage of some health services, periodic health care check-ups, preventive services and the provision of health facilities, etc., of both individuals and society.17 It is noteworthy that employment is deemed as a communication channel between education and income, which directly and indirectly affects the health status by encountering risky working conditions and influencing health behaviours.35,36 Occupation or employment status is evaluated as a socio-economic indicator reflecting the position of the individual in the social texture and thus determines the accessibility to resources, facing psychological risks and physical hazards, and ultimately the effect on lifestyle.37
In our study, people living in 3 general districts in Tehran; the north (OR: 5.59, P = 0.001), south (OR: 3.63, P = 0.063) and east (OR: 2.53, P = 0.003),
have been feeling the need for dental services more than those residents in the centre. The odds ratio indicates that southern inhabitants in the capital exhibited the need 3.6 times more than those living in the central region. However, the southern residents who demanded dental services were only one-quarter (25%) the number of those living in the centre who sought to receive these services for the same period. This difference was statistically significant (OR: 0.25, P = 0.049). Accordingly, it can be said that many of the existing needs for dental services in the south of Tehran remain latent and do not convert to actual demand for these services because of the wide variation in the economic, social and cultural situation of residents, which can lead to inequality in the level of oral and dental health in Tehran. Compared to other regions, especially the south, residents in the northern areas of Tehran have mostly higher income levels, more facilities and financial access. This can lead to more need and demand for families living in these areas for dental services. On the other hand, residents in the southern areas of Tehran are mainly with lower incomes, facilities and access. These harmful conditions can increase the need for dental services and, in contrast, restrict the demand for dental services. Generally, multi-variable interaction with the residential area affects the need and demand for dental services. Another noteworthy point is that Tehran’s military settlements and medical centres are mainly located in its eastern region, affecting the need and demand for dental services in MSAFs in these areas by providing physical access.
As one of the largest capitals worldwide, Tehran is composed of 22 districts inhabited by millions of people, leading to broad and deep diversity among the families in terms of social, economic and cultural conditions.19 Concluded from the prior studies, the level of access and quality of health services will vary according to socio-economic status.38 In his study, Wen found a clear correlation between urbanisation levels and the extent of benefiting from dental services. Generally, the chance of receiving preventive and curative dental services increased with high levels of urbanisation.39 Also, Lee et al. reported that marital status and access based on living area, urban or rural, were associated with the utilisation of dental care. They stated that the lower the ruralisation rate and number of dentists, individuals have a greater likelihood of using dental care.24 In their study, Bourne and McGrowder in Jamaica showed a significant association between health status and area of residence.40 Nevertheless, Howlader demonstrated a positive but non-significant relationship between health status and residential area in Bangladesh.40
The study results also showed that the increase in both waiting time and household size increased the likelihood of sense to the need for dental services (OR: 1.00, 1.32, P < 0.1). Although the odds ratio related to waiting time was approximately one that related to household size variable was greater than 1. This indicated that increasing households by one person will increase need for dental services by 0.32. This result was consistent with Stoyanova’s study in which there was a positive relationship between the number of households (household size) and the likelihood of demand for dental services.41 The main indicators of income; housing status, wealth and property, are calculated as a proportion of the number of people living in the household.42 Therefore, with the increase in the number of households, the ratio of total income/wealth to the household decreases and can therefore increase the negative effects of health costs and reduce financial access to services. Based on a study conducted in Iran, increasing household size has increased the potential of solidarity between family members against high health costs.43 Amery et al.’s research undertaken in Yazd province displayed a significant relationship between increasing the family size and the capability of more households to encounter the burden of health expenses.44 It also seems that existing health insurance coverage and access to dental services provides the basis for facilitating the use of these services as much as possible for households with a smaller number of family members.
Inequality in socio-economic status can lead to health inequality. Despite its being an important global issue, health inequality and its socio-economic determinants for health policy have notably increased recently.45 Meanwhile, studies published on dental services are rare. It should be considered that the study of socio-economic factors affecting the demand for dental services is effective in predicted dental demand and dental services labour training and planning.46 In addition, consumers’ perception of quality of healthcare services is one of the factors influencing the formation of dental service demand behaviour,47 it’s worthy to for sufficient attention in future studies.
Limitations and strengths
The study was conducted only in Tehran, but for better understanding and comparing the demand for dental services and existing inequalities geographically, this study can be done in other cities. In this study, the number of samples was not balanced according to the geographic location but was balance according to the MSAFs geographical density. Although the increase of samples in each geographic location can increase the precision of coefficients of geographical inequality, the sample was sufficient to run the regression without the multi-collinearity issue of sampling. However, the unequal numbers of samples in each of the five locations cannot affect the validity of results because the minimum number of samples in each geographical area was sufficient to run the logistic regression without any error. Moreover, the estimated parameters of the regression model based on geographical area in both perspectives of need and demand for dental services was completely consistent with theoretical expectations.
This study had some strength. First, it may be the first study on the behaviour of consumers of dental services among MSAFs with the demand function estimation approach in Iran. Second, with a systematic approach, in addition to the main socio-economic variables, the variables of fear and anxiety were studied simultaneously by multivariate analysis. Finally, the demand function of dental services was estimated by two approaches, need- based and demand-based.
Conclusion
In the current study, there are statistically significant inequalities based on the different socio- economic levels in terms of the need for dental services. Sense of need for dental services has varied significantly according to educational, occupational and geographic groups. There is also considerable geographical inequality between the regions of Tehran in terms of demand. The demand for dental services in people living in the south of Tehran was a quarter of that of residents in the central regions, while the sense of need for these services was three times more than that of the central regions. Accordingly, the present study suggests that measures of active dental screening should be taken according to the socio-economic status governing the different areas of Tehran.
List of abbreviations
LMICs: low and middle-income countries
MSAFs: military-sector-affiliated families
Corresponding Author: Sayyed_Morteza Hosseini_ Shokouh, hosainysh.morteza@gmail.com
Authors: M Meskarpour_Amiri1, SD Mosavi2, E Tahmasebi3, SM Hosseini_Shokouh1,4*
1 Health Management Research Center, Baqiyatallah University of Medical Sciences, Tehran, Iran
2 Students’ Research Committee, Faculty of Health, Baqiyatallah University of Medical Sciences, Tehran, Iran
3 Research Center for Prevention of Oral and Dental Diseases, Baqiyatallah University of Medical Sciences, Tehran,Iran
4 Faculty of Health, Baqiyatallah University of Medical Sciences, Tehran, ScencSciences. Tehran, Iran.