INTRODUCTION
RECENT ADVANCES IN TECHNOLOGY have resulted in the emergence of a new method of screening for cancer in women. There is an existing widely established method that has good reliability. The new method has been evaluated overseas and has been widely adopted as an acceptable alternative to the older widely established method.
Current Australian health policy is that the new test alone cannot be trusted to confer the same degree of accuracy as the old test.1 If doctors or women wish to use the new test an additional cost is involved.
The old test (also known as the Papanicolau or ‘P’ test) and the new test (also known as the Thin Prep or ‘T-test) may have to be repeated due to unsatisfactory technique. If the technique is satisfactory, then either a negative or positive result is given. If the test is negative, the woman is advised to have the test repeated again in two years in most cases. If the test is unsatisfactory, it must be repeated and a negative result obtained. If the test is again unsatisfactory, the woman is referred to a specialist for assessment. The specialist will determine by special technique if the woman has the disease or not. If the test is positive the woman is referred to a specialist for assessment to determine if she has the disease or not.
POLICY
The ADF has been advised to continue using the old test and to test more often than recommended. There appeared to be little basis for this opinion and the resultant departure from national policy raises ethical issues.
National policy is based on studies in civilian populations. These populations may differ from the Australian Defence Force (ADF). Therefore, an attempt should be made to review the methods and make an informed decision in terms of best possible outcome for the females concerned and thus the ADF.
METHODOLOGY
The problem lends itself to decision tree analysis utilising Baye’s Theorem. References have been sought from numerous sources. Where possible ADF data has been utilised.
The tests results from both tests from Unit 1 (sample of 571) were compared with the test results from Unit 2 (sample of 86). The two samples were comparative. Therefore, it can be assumed that Unit 1 is a representative sample of the ADF. Unit 1 results were of a larger number, so will be more valid in statistical comparisons. For Unit 1, P testing was previously well established and T testing was introduced in 1998. P testing resulted in 15% unsatisfactory tests, whereas T testing resulted in only 4% unsatisfactory tests.
Following unsatisfactory tests, the test must be repeated. Following repeat testing, all unsatisfactory and positive tests are referred. P testing, when satisfactory, tested 68% negative and 32% positive at Unit l. T testing, when satisfactory, tested 81.72% negative and 13.98% positive also at Unit l. Follow up data on presence or absence of disease was not available for the ADF samples. The results of previous studies have a lot of information on presence of disease after testing.
A comprehensive study has determined the sensitivity and specificity of the tests and, from this, we can use Baye’s Theorem to determine the probabilities of disease (state of nature) given the results of the tests. Health Insurance commission statistics (and ADF data) also confirm that the overall prevalence of the disease is 3.6%.7 Thus the studies also show reasonable representation of Australian data.
Australian population data8 put the number of females aged 15 to 70 at 6,650,055. The recorded number of P tests in Australia was 1,325,680 in 1999.6 As a maximum (many P tests need to be repeated due to an unsatisfactory result and some females need P tests six-monthly), this represents only 19.9% of the Australian female population. Given that the current recommendation is for every eligible female to have tests every two years, at best only 39.87% of females are having P tests every two years. Thus, given this situation, it is highly likely that the rates of disease in the Australian population are underestimated.
P TESTS
We are given the ‘true positive rate’ as 81.6%. The true positive rate is defined as true positives/ (true positives + false negatives).9 This equates to a probability of 0.8160. We are also given the true negative rate as 95.8% (true
Negatives/ (true negatives+ false positives))”-
| P TEST | DISEASE | |
|---|---|---|
| TEST | POSITIVE | NEGATIVE |
| POSITIVE | 0.816 | 0.042 |
| NEGATIVE | 0.184 | 0.958 |
| 0.036 | 0.964 | |
BAYE’S THEOREM:
P (AIB) = P (BIA)* P(A)
P(BIA)*P(A) + P(BIAII)* P(AII)
Thus, we want to know the probabilities of disease given the results of the test and we know the probabilities of the test given disease.
Disease present = D+; Disease absent = D-; P test positive = P+; P test negative = P-
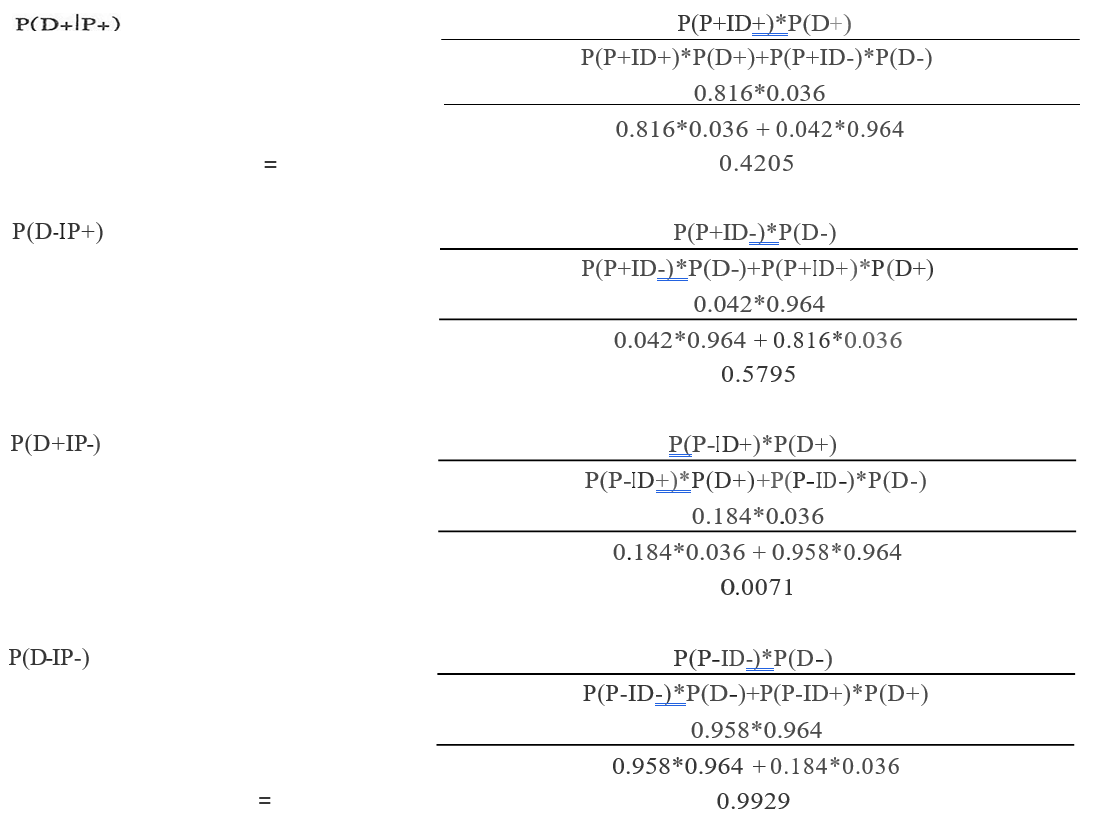
| P TEST | DISEASE | |
|---|---|---|
| TEST | POSITIVE | NEGATIVE |
| POSITIVE | 0.4205 | 0.5795 |
| NEGATIVE | 0.0071 | 0.9929 |
T TESTS
We are given the ‘true positive rate’ as 92.6%. True positive rate is defined as true positives/(true positives
+ false negatives). This equates to a probability of 0.9260. We are also given the true negative rate as
95.8% (true negatives/ (true negatives+ false positives).
BAYE’S THEOREM:
P (AIB) = P (BIA)* P(A)
P(BIA)*P(A) + P(BIA”) * P(A”)
Thus, we want to know the probabilities of disease given test and we know the probabilities of test given disease. Disease present= D+; Disease absent= D-; T-test positive= T+; T-test negative= T-.
T (D+IT+) = T (T+ID+) * T(D+)
T(T+ID+) *T(D) + T(T+ID-) * T(D-)
0.926*0.036
0.926*0.036 + 0.042*0.964
0.4516
T (D-IT+) = T (T+ID-) * T(D-)
T(T+ID-) *T(D-) + T(T+ID+) * T(D+)
0.042*0.0964
0.042*0.964 + 0.926*0.036
0.5484
T (D-IT-) = T (T-ID+) * T(D+)
T(T-ID+) *T(D+) + T(T-ID-) * T(D-)
0.074*0.036
0.074*0.036 + 0.958*0.964
0.0029
T (D-IT-) = T (T-ID-) * T(D-)
T(T-ID-) *T(D-) + T(T-ID+) * T(D+)
0.958*0.964
0.958*0.964 + 0.074*0.036
0.9971
Constructing the conditional probability table:
| P TEST | DISEASE | |
|---|---|---|
| TEST | POSITIVE | NEGATIVE |
| POSITIVE | 0.4516 | 0.5484 |
| NEGATIVE | 0.0029 | 0.9971 |
If the T-test is negative, then there is a 0.9971 probability that the disease will be absent, and a probability of .0029 that it will be a false negative. If the P test is positive, then there is 0.4516 probability of disease being present, and 0.5484 probability of the disease being absent (false positive).
For unsatisfactory tests, there is no information available as to whether there are differing rates of disease amongst this group. Thus, the same rates of disease versus no disease for each test will be used.
When the female is referred for assessment following a positive test (or repeated unsatisfactory), she undergoes a procedure and consultation. If the disease is found to be present following this assessment, then she will have minor surgery. Minor surgery will result in one day in hospital and approximately seven days sick leave. If the disease is not detected in time, which will be the consequence of all false-negative tests or no testing when disease is present, then the woman will have to have major surgery.
The average daily income of women in the ADF is 314.78. This was calculated using ADF 1999 census data11 and the DMPLS ready reckoner. 12 This figure was used in the calculation of ‘loss to the ADF’ for an individual in hospital or on sick leave.
CALCULATING PAYOFFS (IN 2000 $AUD)
Cost of performing a P test
Test cost + Doctors wages (112 hour)
= $18.50 + $35.00 = $53.50
Cost of performing a T test
= $27.00 + $35.00 = $62.00
Cost of performing both tests (current cost) = $80.00
Referral for assessment
= Procedure Cost + Consultation cost
= $49.70 + $150.00 = $199.70
Minor surgery
Surgery + anaesthetic + consultations + theatre
+ hospital cost +7 days
$169.75 + $127.31 + 2*$150.00 + $500.00
+ $300.00 + 7*$314.78 = $3300.52
Major surgery
= Surgery+ anaesthetic + consultations+ theatre
+ 7 days hospital costs + 30 days sick leave
= $791.25 + $ 593.44 + 6*150.00 + $500.00
+ $2100.00 + $9443.40 = $13428.09
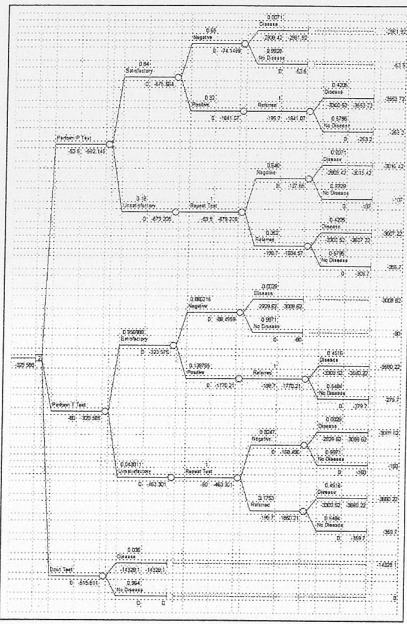
These values can be placed onto a decision tree.
We know that the 5-year mortality rate for this disease is 14%. Thus, left undiagnosed and treated for five years, 14% will develop cancer and die. If diagnosed in this late stage, the costs of treatment are much greater. The costs of treatment steadily rise the longer the disease is left to develop into cancer. If we assume that the ADF will utilise national policy of two-yearly testing, the proportionate cost of a false negative can be calculated.
If we try to determine the line for PAP smears, we know that they will cost $53.50 (= Y-intercept), thus we know one point one the line (0,53.50) and the second point is (5, 13428.09).
Using: Y = aX+ c and substituting for X= 0, y = 53.50.
Substituting to find a: 14328.09 = a*5 + 53.50; a= 2854.92
Thus, the costs to the ADF of a false negative are:
| X | Y |
|---|---|
| YEARS | COST |
| 1 | -2908.42 |
| 2 | -5763.34 |
| 3 | -8618.26 |
| 4 | -11473.18 |
| 5 | -14328.10 |
| 6 | -17183.02 |
| 7 | -20037.94 |
| 8 | -22892.86 |
| 9 | -25747.78 |
| 10 | -28602. 70 |
This demonstrates that if is decided that testing would occur every year then the cost to the ADF for one female developing cancer in that time is $2908.42. If it is decided that an appropriate interval is two years, then the costs per female developing cancer in that time is $5763.34 and so on. Lengthening periods of time between testing will impact the overall cost to the ADE We can individually calculate the expected monetary value of testing at each interval. The costs increase with time. Thus, the more frequent testing is done, the better. It is difficult to determine what frequency is too frequent or not necessary, and perhaps should be the subject or another, more involved paper.
The disadvantages of testing too frequently are:
- Increasing health care costs for unknown addition al benefit. While the reported abnormality rate of the ADF is higher than the abnormality rate of the general population, in the general population only 19% of females undergo testing each year, hence there is likely to be underreporting of the true incidence of the disease. The tests are reliably sensitive (>99%), so at this stage there would appear to be no reason to increase frequency of testing for the ADF in general.
- Initial and ongoing outlays that the system may be unable to support. The EMV reduces (becomes more negative) with increasing time between testing, thus overall costs increase with increasing frequency.
- Reduced compliance and acceptance amongst the female population. Having to return for a higher frequency of testing will reduce the acceptance of the testing.
- Not a great deal is known about the time delay for the development of invasive cancer. Previous studies have put the time delay at approximately seven years from first affected. Obviously, the purpose of the test is to catch the early form of the cancer before it becomes invasive.
RESULTS
The decision tree above is the decision tree for this problem. The expected monetary value (EMV) decision rule selects the decision alternative with the largest expected value to the ADF The EMV decision rule has selected decision two as the best option. This is primarily because there are less unsatisfactory tests and less false-negative tests with test T. From an expected monetary value perspective, it is better to not test than do P tests ($515.18 vs $592.15).
CONCLUSIONS
The ADF reports a higher rate of positive P and T-tests than the general Australian population. This, however, may be the result of under-reporting (under testing) in the Australian population.
When analysed in this manner, T-tests have the highest expected monetary value when compared to
P tests and no testing. The EMV for T-tests is $329.58, a P test is $592.15 and no testing is $515.81. Thus, the ADF could afford to pay up to $250.00 for T-tests and still be at a higher EMV than either not testing or P tests.
There is no reason to increase the frequency of testing for the ADF, given the high negative predictive values of the tests. Increasing the frequency of testing may also be an unpopular decision amongst the recipient female population.