
Abstract
Background: Psychosocial risk factors have been identified as factors for prolonged occupational disability in individuals with debilitating musculoskeletal injuries, chronic pain and mental health conditions.
Purpose: This study has the complementary aims of identifying the correlations of psychosocial risk factors with (1) symptom profile factors and (2) the perceived impact of health conditions on the performance of daily activities based on the behavioural indicators of veterans referred for interdisciplinary rehabilitation in a sample of veterans of the Canadian Armed Forces (VCAF).
Materials and methods: We used a retrospective and cross-sectional non-experimental correlational analysis study design. The correlational analyses were performed using the following variables: psychosocial risk factors and symptom profile factors, and the perceived impact of health conditions on the performance of daily activities based on behavioural indicators.
Results: A statistically significant correlation was found between the overall Sickness Impact Profile (SIP) score and perceived disability, catastrophic thoughts, perceived injustice, fear of movement, and between fatigue and the physical dimension SIP score.
Conclusion: Veterans who have an alarmist view of their symptoms, who are fearful of exacerbating their symptoms through movement, and who harbour feelings of unfairness or injustice experienced a greater perceived impact of their health conditions on their performance of daily activities.
Keywords: Psychosocial support systems, Veterans, Outcome assessment, Healthcare, Multiple chronic conditions
Conflict of interest: The author, Antonio Miguel Cruz, received a research grant from the Occupational Performance Assessment Unit (OPAU) located at the Department of Occupational Therapy, Faculty of Rehabilitation Medicine, University of Alberta, to conduct this study.
Introduction
The total estimated Canadian veteran population is 649 300.1 The Life After Service Survey (LASS) 2016 showed that veterans suffer more chronic conditions than Canadians of the same age and sex, e.g. arthritis (LASS: 29%, general population: 9.7%), anxiety (LASS: 15%, general population: 12.5%), and post-traumatic stress disorder (PTSD) (LASS: 14%, general population: 2%).2,3 A recent systematic literature review of studies investigating the effectiveness of interventions addressing the disabilities of active members of the military and/or veterans found that the most commonly addressed impairment was PTSD.4 Miguel Cruz and colleagues found that numerous studies have implemented interventions that aim to change lifestyles for post- traumatic headaches, and interventions that address alcohol abuse, suicide ideation and behaviour, and stigma reduction (e.g., self-stigma was observed in relation to one’s negative perceptions of self when seeking help or having mental health issues). Only a handful of studies have explored the role of the correlations/associations of psychosocial variables as risk factors for prolonged occupational disabilities in individuals with debilitating musculoskeletal injuries, chronic pain, PTSD and other mental health conditions.4 Perceived disability, catastrophising, perceived injustice and fear of exacerbating symptoms have been identified as the most common psychosocial variables as risk factors for prolonged occupational disability in individuals with debilitating musculoskeletal injuries, chronic pain, PTSD and other mental health conditions.5 Symptom profile factors of pain, severity of depressive symptoms and fatigue have also been identified as contributing risk factors to prolonged disability.6 In veteran populations, in particular, studies have shown that pain-related catastrophic thinking is related to a higher risk of suicide attempts7, long-term chronic pain and increased pain perception,8 poor performance in cognitive functions (such as learning and memory)7 and other substance use disorders.9
Chronic pain leads to pain-related disabilities. From a biopsychosocial perspective, chronic pain is the result of a complex amalgamation of biological, psychological and social factors. Pain- related disability encompasses a variety of domains, including physical, occupational, recreational and social functioning.10,11 The Fear-Avoidance Model of Pain and Disability is a useful framework for explaining the relations between the aforementioned factors.10 Simply put, the Fear-Avoidance Model of Pain and Disability posits that pain-related fear activates escape mechanisms that lead to the avoidance of movement and activity. In other words, the long-term avoidance of physical activity may impair functioning, increase negative mood and lead to greater levels of disability.11 There is still some disagreement among researchers regarding the sequential relationships between the psychosocial risk factors in the Fear-Avoidance Model of Pain and Disability. For example, one key point in this debate is whether changes in catastrophising precede changes in pain-related fear. Veterans of the Canadian Armed Forces who were referred to our clinic for interdisciplinary rehabilitation (physical and occupational therapy) presented with a complex clinical picture of chronic pain with poor sleep and undue fatigue, chronic musculoskeletal injuries, mental health conditions and medical conditions, i.e. an amalgamation of psychosocial and symptom profile variables that represent a higher risk of prolonged disability. Thus, we believe that the Fear- Avoidance Model of Pain and Disability of chronic pain is a useful framework for studying this pain- related disability in our sample of veterans.
This study has the complementary aims of identifying the correlations of psychosocial risk factors with (1) symptom profile factors and (2) the perceived impact of health conditions on the performance of daily activities based on the behavioural indicators of veterans referred for interdisciplinary rehabilitation. Table 1 shows the variables and measures used in our study. The identification of the correlations between these variables is expected to provide insights for occupational therapists and other healthcare providers working with veterans into possible ‘red flags’ for prolonged disability. The associations may assist with treatment planning that is focused on factors that are likely to improve the quality of life and wellbeing of veterans as expressed through perceived occupational performance in the psychosocial and physical domains, as well as in their daily activities.
The Canadian Model of Occupational Performance and Engagement (CMOP-E): a brief overview
Specifically conceptualised to consider the entire person-in-environment and make sense of this complexity, the Canadian Model of Occupational Performance and Engagement (CMOP-E) provides a conceptual framework that is holistic in its approach, ecologically interactive and puts the person as a whole at the centre. One of the CMOP-E’s main goals is that clients achieve satisfying levels of occupational performance.12 According to the World Federation of Occupational Therapy: ‘…occupations refer to the everyday activities that people do as individuals, in families and with communities to occupy time and bring meaning and purpose to life. Occupations include things people need to, want to and are expected to do…’13 Occupational performance in the CMOP-E is understood to be a dynamic interaction between a person, his/her occupation, and the environment. A person has three performance components: cognitive, affective and physical, with spirituality at the core, acknowledging that people derive their sense of identity, meaning and purpose ‘from everyday life activities’.14
A person’s performance components are also known as his/her internal resources.12 The CMOP-E indicates that a person lives in a unique environment, showing that he/she is embedded within the cultural, institutional, physical and social dimensions of this environment. A person’s occupation is the means by which he/she acts within this environment; in other words, ability demonstration is recognised as occurring within a context, which can have both a positive and negative influence on his/her perception of performance (see Figure 1 for more details). The CMOP-E identifies three occupational purposes: self- care, productivity and leisure.
Figure 1– The Canadian Model of Occupational Performance and Engagement (CMOP-E)10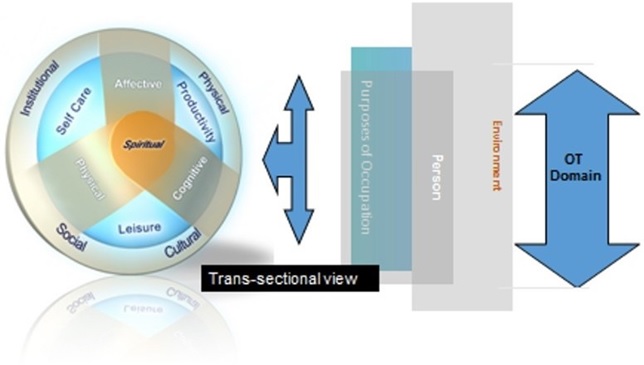
Note: The Engagement construct is not shown in the model, but is implicit and a descriptor of the inherent process
The Occupational Performance Assessment Unit’s individualised intervention
In 2007, the Occupational Performance Analysis Unit (OPAU) began receiving referrals from case managers at Veterans Affairs Canada (VAC) to provide multidisciplinary rehabilitation for veterans enrolled on the VAC Rehabilitation Program under the newly proclaimed New Veterans Charter. We sought and became registered with VAC as a Multidisciplinary Clinic (MDC) and implemented a standard assessment and treatment protocol for veterans, many with complex presentations, based on the CMOP-E. Our high-skill, low-volume service model in a not-for-profit environment enables client-centred service delivery through physical and occupational therapy. This service aims to decrease the disabilities associated with a veteran’s service-related health conditions and to restore the level of functioning and wellbeing that could reasonably be expected within a three to six-month period (i.e. a period of active, focused rehabilitation versus maintenance intervention). Attendance at our program is typically twice per week for 24 physical therapy sessions, and for occupational therapy, sessions total 10–30 hours, depending on their identified needs. The scheduling was modified to accommodate the veterans’ other medical appointments, family commitments, environmental triggers (such as traffic) and activity tolerance. Progress was monitored weekly, and the treatment approach was modified as necessary. Our initial three-hour assessment consisted of a physical therapy examination, an occupational therapy clinical interview, and the administration of the self- report instruments, among them the Progressive Goal Attainment Program (PGAP),15 which screens questionnaires for the psychosocial risk of pain- related disability and the Sickness Impact Profile (SIP) (see Variables and measures for more details). The findings were documented in a detailed assessment report and recommended treatment plan.
Methods
Study design
Retrospective and cross-sectional correlational analysis.
Data source
The data source used in this study is a primary source of information from the clients’ paper-based files located at the OPAU service. (n=250, i.e. the full population of clients in the OPAU). This is a paper-based database with files from over 10 years, from 2009 to 2019. The data were extracted from a subsample of 64 veteran client files (see the Sample size calculation section). We gathered one-time assessment data over the 10 years.
Sample size calculation
A subsample of the veteran client files contained in the clinical paper-based database was selected for this study (n=64, effect size 0.5, power 0.8, alpha 0.05).16 The effect size of 0.5 was selected according to the values obtained in similar correlational studies.17,18 This study’s subsample was randomly selected using a proportional stratified sampling method (by sex, i.e. female (total females 51, i.e. 20.3%, 51/250) or male (total males 199, i.e. 79.7%, 199/250)). The total number of males and females selected in our sample was as follows: Total males 51.008 (64X0.797) » 51, total females 12.992 (64X0.203) » 13 (see Table 1 for more details)
Participants
Our sample comprised non-catastrophically injured veterans who had decreased engagement in meaningful, purposeful activities and life roles, who were not gainfully employed, who were enrolled onto the Veterans Affairs Canada (VAC) Rehabilitation Program and who had been referred by their VAC Case Manager to our clinic for the comprehensive interdisciplinary rehabilitation services. VAC offers veterans a wide range of health programs and services, family support, financial programs and services, and training and employment services.
Variables and measures
Table 1 – Variables and measures
| Dimension or component | Construct/measure | CMOP-E dimension | Questionnaire or assessment tool | Acronym |
|---|---|---|---|---|
| Psychosocial risk for pain-related disability | Perceived disability | Occupation | General Pain Disability Index Questionnaire | GPDI |
| Perceived injustice | Person-affective | Modified Injustice Experiences Questionnaire (CIEQ-Chr) The first five items of the CIEQ-Chr assess perceived injustice |
CIEQ-I | |
| Catastrophic thoughts | Person-affective | Modified Injustice Experiences Questionnaire (CIEQ-Chr) The last seven items of the CIEQ-Chr assess catastrophizing thinking |
CIEQ-C | |
| Exacerbating symptoms (or fear of movement/ kinesiophobia) | Person-affective | Fear and Fatigue Questionnaire (FFQ- Chr) The first five items of the FFQ-Chr assess fear of exacerbating symptoms |
FFQ-K | |
| Fatigue | Person-physical | Fear and Fatigue Questionnaire (FFQ- Chr) The last five items of the CIEQ-Chr assess fatigue |
FFQ-F | |
| Symptom profile factors that impact daily functioning and behaviour | Pain symptoms | Person-physical | Short-form McGill Pain Questionnaire | MPQ-SF |
| Severity of depressive symptoms | Person-affective | Patient Health Questionnaire-9 Nine-item depression module from the Patient Health Questionnaire (PHQ) |
PHQ-9 | |
| Perceived impact of health condition on daily functioning (activities) and behaviour | Quality of life (QoL) and perceived health status (PHS) | Person-occupation | Sickness Impact Profile (Overall Score) | SIP-O |
| Person-physical | Sickness Impact Profile (Physical Dimension Score) | SIP-PD | ||
| Person-physical | Physical domain-Ambulation | SIP-A | ||
| Person-physical | Physical domain-Mobility | SIP-M | ||
| Occupation-self care | Physical domain-Body Care and Movement | SIP- BCM | ||
| Person-affective | Sickness Impact Profile (Psychosocial Dimension Score) | SIP-PSD | ||
| Person-affective | Psychosocial domain-Social Interaction | SIP-SI | ||
| Person-cognitive | Psychosocial domain-Alertness Behaviour | SIP-AB | ||
| Person-affective | Psychosocial domain-Emotional Behaviour | SIP-EB | ||
| Person-physical | Psychosocial domain-Communication | SIP-C | ||
| Occupation-self care | Independent category – Sleep and Rest | SIP-SR | ||
| Occupation-self care | Independent category – Eating | SIP-E | ||
| Occupation- productivity | Independent category – Work | SIP-W | ||
| Occupation- productivity | Independent category – Home Management | SIP-HM | ||
| Occupation-leisure | Independent category -Recreation/ Pastimes | SIP-RP |
Table 1 shows the dimension or component, the construct/measure, the CMOP-E dimension, the questionnaire or assessment tool, and the acronyms of the variables and measures used in our study.
Psychosocial variables as risk factors for pain-related disability
In this study, we used the PGAP screening questionnaires for the psychosocial variables as the risk factors of pain-related disability. These questionnaires comprise the following measures:
General Pain Disability Index Questionnaire. The General Pain Disability Index Questionnaire (GPDI) was used to assess perceived disability (a belief that one has a high level of disability).11 The GPDI has six items and uses an 11-point Likert-type scale with responses ranging from 0 = ‘no disability’ to 10 = ‘total disability’ for the clients to indicate to what degree they feel disabled in the five areas of family/home responsibilities, recreation, social activity, occupation and self-care. Prior research has demonstrated that the GPDI has good psychometric properties, i.e. high internal consistency (Cronbach’s alpha = 0.81) and moderate test-retest reliability (correlation coefficient = 0.42).18 The value of the Cronbach’s alpha = 0.81 is comparable to that reported for the original version of the scale (Cronbach’s alpha = 0.86).19
Modified Injustice Experiences Questionnaire. The Modified Injustice Experiences Questionnaire (CIEQ-Chr) was used to measure catastrophising (an excessively negative view of one’s symptoms) and perceived injustice (an appraisal of cognition comprising elements of severity of loss due to injury, blame and a sense of unfairness and irreparable loss).15 The CIEQ-Chr uses a three-point Likert-type scale with responses ranging from 0 = ‘never’ to 2 = ‘often’. The first five items assess perceived injustice (CIEQ-I) (based on the 12-item Injustice Experience Questionnaire (IEQ)),15 and the last seven items assess catastrophising (CIEQ-C) (based on the 13- item Pain Catastrophizing Scale21). Prior research has demonstrated that the CIEQ-Chr Questionnaire has excellent psychometric properties, i.e. high internal consistency (Cronbach’s alpha = 0.88).22
Modified Fear and Fatigue Questionnaire. The modified Fear and Fatigue Questionnaire (FFQ- Chr) was used to assess the fear of exacerbating symptoms and fatigue.15 The FFQ-Chr uses a four- point Likert-type scale with responses ranging from 0 = ‘do not agree’ to 3 = ‘completely agree’. The first five items of the FFQ-Chr assess fear of exacerbating symptoms (FFQ-K) (based on the Tampa Scale for Kinesiophobia23), and the last five items assess fatigue (FFQ-F) (Multidimensional Fatigue Scale24). Both subscales have shown excellent psychometric properties, i.e. high Cronbach’s alpha coefficients ranging between 0.74 and 0.87, and strong test- retest reliability (correlation coefficient = 0.75).
Symptom profile variables as factors that impact daily functioning and behaviour
Pain symptoms. The short-form McGill Pain Questionnaire (MPQ-SF) was used to assess the sensory and affective dimensions of pain.25 The MPQ- SF comprises 15 words that describe the various sensory and affective qualities of pain, and asks the client to use a four-point Likert-type intensity scale with responses ranging from 0 = ‘none’, 1 = ‘mild’, 2 = ‘moderate’, to 3 = ‘severe’ to rate their experience of these qualities. The individual responses are added up to yield a total score, with higher scores indicating a more severe pain experience. The reliability and validity of the MPQ-SF have been demonstrated in several clinical and experimental studies, i.e. high internal consistency (Cronbach’s alpha = 0.926) and a strong test-retest reliability metric (correlation coefficient = 0.85).26
Severity of depressive symptoms. The Patient Health Questionnaire-9 (PHQ-9) is a nine-item depression module from the Patient Health Questionnaire (PHQ).27 The PHQ-9 uses a four-point Likert-type scale with responses ranging from 0 = ‘not at all’ to 3 = ‘nearly every day’. The responses are added up to yield a total score, with higher scores indicating more severe symptoms of depression. The reliability and validity of this measure have been established in several different clinical samples, i.e. high internal consistency reliability (Cronbach’s alpha 0.89) and strong test-retest reliability (correlation coefficient=0.94).28
Perceived impact of health conditions on daily functioning (activities) and behaviour
The SIP is a quality of life measurement that quantifies a person’s perception of the impact of their health conditions on their performance of daily activities based on behavioural indicators. The SIP is a reliable instrument that we use as an analogue for perceived occupational performance.27 The SIP contains 136 statements to which the respondent is instructed ‘to check only those statements that you are sure describe you today and are related to your state of health’. The statements are divided into 12 areas of activity which are categorised into three domains: the physical domain (SIP-PD); the psychosocial domain (SIP-PSD); and an ‘independent’ category. Included in the physical domain are ambulation (SIP-A), mobility (SIP-M), and body care and movement (SIP- BCM). In the psychosocial domain are Social Interaction (SIP-SI), Alertness Behaviour (SIP-AB), Emotional Behaviour (SIP-EB) and Communication (SIP-C). In the independent category are Sleep and Rest (SIP-SR), Eating (SIP-E), Work (SIP-W), Home Management (SIP-HM) and Recreation/Pastimes (SIP-RP). Percentage dysfunction scores are calculated for each of the 12 areas, as well as for the physical domain and psychosocial domain, and an overall score. A score of 20% or more indicates a perceived severe impact on the person’s health condition in that area.30 The reliability and validity of the SIP are high, i.e. internal consistency reliability (Cronbach’s alpha=0.94) and strong test-retest reliability (correlation coefficient = 0.92).29 The SIP has shown good divergent validity with the Canadian Occupational Performance Measure (COPM).29 It should be noted that the psychometric properties of the SIP are for the entire instrument and not for each of the 12 areas.
Demographics
The demographic data include age, gender (female or male), Body Mass Index (BMI) (normal, overweight or obese), marital status (married/common law, widowed/separated/divorced or single/never married), and the highest level of education completed (pre-high school, high school, post- secondary graduation or university degree).
Procedures
We received approval from the University of Alberta Ethics Board before starting to compile the data from the clinic files. The data from the client files were entered into an SPSS® file. Finally, two independent reviewers assessed the validity and integrity of 100% of the data entered into the SPSS® file.
Statistical analyses
The demographic characteristics were analysed using means, standard deviations, and frequencies/ proportions. A correlational analysis was performed to explore the correlations between the measures of our study. We used nonparametric Spearman’s rho (or parametric Pearson for the SIP dimensions) correlations due to the type of data in our stud.14 We used the following cut-offs to interpret the strength of the relationships between our variables: 0.00–0.29 indicated a weak or negligible correlation; 0.30–0.49 indicated a moderate correlation; higher than 0.50 indicated a strong correlation31,32 (p <0.05, two- sided).
We used IBM SPSS® (Version 26.0; IBM Corporation, Armonk, NY) to perform our statistical analyses.
Results
Participants
Table 2 shows the characteristics of the sample of 64 veterans who were referred for the interdisciplinary rehabilitation services at our clinic. They were characterised as adults (mean age of 42.62 years old, SD (8.99)), mainly male (79.7%) and non-officers when released (98.4%). Most were overweight (32.8%) or obese (51.6%) (total 84.4%) with a mean BMI (in kg/m2) for the entire population of 30.39 SD (5.024), more than half were married (56.3%), and the highest level of completed education for most was high school (62.5%). Overall, the participants had served an average of 15.83 SD (8.25) years, mostly in the Army (84.4%). Table A.1 in the supplemental material also shows that OPAU clients have multiple chronic medical conditions, i.e. those mainly associated with chronic pain (90.6%), back problems (84.4%), mood disorders (82.8%), anxiety disorders (76.6%), PTSD (53.1%), and musculoskeletal disorders (95.3%).
Table 2 – Sample characteristics (descriptive statistic)
| Mean (years) (SD) | 42.62 SD (8.99) | ||
| Body Mass Index (SD) | 30.39 SD (5.024) | ||
| Category | n | % | |
| Age (in years) | <30 | 8 | 12.5 |
| 30–39 | 13 | 20.3 | |
| 40–49 | 24 | 37.5 | |
| 50–59 | 18 | 28.1 | |
| 60–69 | 1 | 1.6 | |
| Gender | Female | 13 | 20.3 |
| Male | 51 | 79.7 | |
| Body Mass Index | Normal | 10 | 15.6 |
| Overweight | 21 | 32.8 | |
| Obese | 33 | 51.6 | |
| Marital status | Married/Common law | 36 | 56.3 |
| Widowed/Separated/Divorced | 15 | 23.4 | |
| Single, never married | 13 | 20.3 | |
| Education (Highest level of education completed) | Pre-high school graduation | 6 | 9.4 |
| High school graduation | 40 | 62.5 | |
| Post-secondary graduation | 13 | 20.3 | |
| University degree | 5 | 7.8 | |
| Rank | Officers | 1 | 1.6 |
| Non-Officer | 63 | 98.4 | |
| Service environment | Air Force | 4 | 6.3 |
| Army | 54 | 84.4 | |
| Navy | 5 | 7.7 | |
| RCMP | 1 | 1.6 | |
| Length of service | < 10 years | 20 | 31.7 |
| 10 to 19 years | 16 | 25.4 | |
| ≥ 20 years | 27 | 42.9 | |
Notes: a. The BMI categories were defined as follows: Normal weight – BMI greater than or equal to 18.5 to 24.9 kg/m2; Overweight – BMI greater than or equal to 25 to 29.9 kg/m2; Obese – BMI greater than or equal to 30 kg/m2
Descriptive statistics of the questionnaire scores
Tables 3a), b) and c) show the descriptive statistics of the questionnaire scores used to measure the psychosocial variables that contribute to pain-related disabilities, symptom profile factors that impact daily functioning and behaviour, and the perceived impact of health conditions on daily functioning (activities) and behaviour, respectively.
Psychosocial variables that contribute to pain- related disabilities. The veterans who receive services at the OPAU see themselves as individuals with high levels of perceived disability. They have reported that these disabilities affect their lives on a day- to-day basis (median of the General Pain Disability Index Questionnaire, GPDI = 7). They reacted with a moderate level of catastrophising thoughts (median CIEQ-C = 5.5) and perceived injustice levels (the median of the first five items of the Modified Injustice Experiences Questionnaire, CIEQ-I = 6) regarding their chronic medical conditions. They had moderate concerns or worries that they might injure themselves again if they were to do certain activities (the median of the first five items of the Fear and Fatigue Questionnaire, FFQ-K = 5) and moderate levels of fatigue when they do physical activities (the median of the last five items of the Fear and Fatigue Questionnaire, FFQ-F = 5).
Symptom profile variables that impact daily functioning and behaviour. The veterans who receive services at the OPAU reported experiencing mild pain symptoms (the median of the short-form McGill Pain Questionnaire, MPQ-SF = 12), and mild symptoms of depression (median PHQ-9 = 14).
Perceived impact of health conditions on daily functioning (activities) and behaviour. Veterans who receive services at the OPAU have high levels of dysfunction in their everyday behaviour related to their diseases (chronic conditions), as 60.0% of the SIP indicators (9/15) showed a threshold with a higher than 20.0% impact (a negative impact on their daily life activities).
Correlations
Table 4 shows the correlations between the variables of our study. With respect to the aims of this study, an inspection of the table shows that the measures of the psychosocial variables that contribute to pain-related disabilities have significant correlations with both the measures of symptom profile factors and the perceived impact of health conditions on daily functioning (activities) and behaviour. Specifically, the psychosocial risk measures of perceived disability (GPDI), perceived injustice (CIEQ-I), catastrophic thoughts (CIEQ-C), fear of movement (FFQ-K) and fatigue (FFQ-F) all had significant positive correlations with the severity of depressive symptoms (PHQ- 9). These correlations ranged from rxy(62) = 0.585 down to rxy(62) = 0.377. At the same time, all the psychosocial risk measures correlated significantly with the overall SIP-O measure of the perceived impact of health conditions on daily functioning (activities) and behaviour. These correlations ranged from rxy(62) = 0.602 down to rxy(62) = 0.396. Specific corrections will be highlighted in the following paragraphs.
Table 3 – Descriptive statistics of the measure score
a) Psychosocial risk for pain-related disability.
| Construct/measure | Questionnaire or assessment tool (Acronym) | Median | Mean | SD | 95% CI | VD |
|---|---|---|---|---|---|---|
| Perceived disability | GPDI | 7 | 6.28 | 2.09 | (5.76, 6.80) | High |
| Perceived injustice | CIEQ-I | 6 | 5.80 | 2.45 | (5.18, 6.41) | Moderate |
| Catastrophic thoughts | CIEQ-C | 5.5 | 5.52 | 2.18 | (4.97, 6.06) | Moderate |
| Exacerbating symptoms (or fear of movement/ kinesiophobia) | FFQ-K | 5 | 5.11 | 2.17 | (4.57, 5.65) | Moderate |
| Fatigue | FFQ-F | 5 | 5.66 | 2.53 | (4.57, 5.65) | Moderate |
Notes: N=64; SD: Standard Deviation; 95% CI: Confidence Interval; VD: Verbal Descriptor. VD-Scale: 0-1: Very Low (VL); 2-3: Low (L); 4-6: Moderate (M); 7-8: High (H); 9-10: Very High (VH)
b) Symptom profile factors that impact daily functioning and behaviour.
| Construct/measure | Questionnaire or assessment tool (Acronym) | Median | Mean | SD | 95% CI | VD |
|---|---|---|---|---|---|---|
| Pain symptoms | MPQ-SF | 12 | 13.73 | 7.64 | (11.76, 15.71) | Mild |
| Pain symptoms | MPQ-SF | 12 | 13.73 | 7.64 | (11.76, 15.71) | Mild |
| Severity of depressive symptoms | PHQ-9 | 14 | 14.20 | 6.04 | (12.64, 15.76) | Mild |
Notes: N=64; SD: Standard Deviation; VD: Verbal Descriptor. VD-scale MPQ-SF: 0: None; 1-15: Mild; 16-30: Moderate; 31-45: Severe; VD-scale PHQ-9: 0-9: Subclinical; 10-14: Mild; 15-19: Moderate; + 20: Severe
c) Perceived impact of health conditions on daily functioning (activities) and behaviour.
| Construct/measure | Questionnaire or assessment tool (Acronym) | Median | Mean | SD | 95% CI |
|---|---|---|---|---|---|
| Quality of life (QoL) and perceived health status (PHS) | SIP-O | 25 | 27.25 | 10.30 | (24.66, 29.85) |
| SIP-PD | 15 | 15.68 | 9.89 | (13.19, 18.17) | |
| SIP-A | 17 | 18.16 | 14.08 | (14.61, 21.70) | |
| SIP-M | 15 | 16.22 | 13.95 | (12.71, 19.73) | |
| SIP- BCM | 12 | 14.13 | 9.61 | (11.71, 16.55) | |
| SIP-PSD | 33 | 34.70 | 17.05 | (30.40, 38.99) | |
| SIP-SI | 33 | 36.95 | 20.91 | (31.69, 42.22) | |
| SIP-AB | 40 | 45.24 | 28.98 | (37.94, 52.54) | |
| SIP-EB | 36 | 41.38 | 20.94 | (36.11, 46.65) | |
| SIP-C | 9 | 12.56 | 15.81 | (8.57, 16.54) | |
| SIP-SR | 34 | 32.27 | 16.90 | (28.01, 36.52) | |
| SIP-E | 3 | 3.36 | 6.03 | (1.85, 4.90) | |
| SIP-W | 70 | 61.87 | 19.57 | (56.94, 66.80) | |
| SIP-HM | 30 | 29.97 | 15.52 | (26.06, 33.88) | |
| SIP-RP | 45 | 43.52 | 18.87 | (38.77, 48.28) |
Notes: N=64; SD: Standard Deviation; SIP-PD: SIP-Physical Dimension; SIP-A: Ambulation; SIP-M: Mobility; SIP- BM: SIP- Body Care and Movement; SIP-PSD: SIP-Psychosocial Dimension; SIP-SI: SIP-Social Interaction; SIP-AB: SIP-Alertness Behaviour; SIP-EB: SIP-Emotional Behaviour; SIP-C: SIP-Communication; SIP-SR: SIP-Sleep and Rest; SIP-E: SIP-Eating;
SIP-W: SIP-Work; SIP-HM: SIP-Home Management; SIP-RP: SIP-Recreation/Pastimes; and SIP-O: SIP-Overall; A score of 20% or more indicates that person’s health condition has a perceived severe impact in that area.
More specifically, a statistically significant correlation was found between the overall SIP-O score (measured by the SIP questionnaire) and perceived disability (GPDI, General Pain Disability Index Questionnaire) (rxy(62) = 0.602, p<0.001); catastrophic thoughts (CIEQ-C, measured by the last seven items of the Modified Injustice Experiences Questionnaire (CIEQ- Chr) (rxy(62) = 0.439, p<0.001); perceived injustice (CIEQ-I, measured by the first five items of the Modified Injustice Experiences Questionnaire (CIEQ- Chr) (rxy(62) = 0.525, p<0.001); fear of movement (FFQ-K, measured by the first five items of the Fear and Fatigue Questionnaire (FFQ-Chr) (rxy(62) = 0.396, p<0.001); and fatigue (FFQ-F, measured by last five items of the Fear and Fatigue Questionnaire (FFQ- Chr)) and the physical dimension SIP score (SIP-PD, ambulation, mobility, and body care and movement) (rxy(62) = 0.290, p<0.001). Also, a statistically significant correlation was found between the overall SIP score and the severity of depressive symptoms (PHQ-9, Patient Health Questionnaire-9) (rxy(62) = 0.669, p<0.001). We found that with increased severity of depressive symptoms (PHQ-9, measured by the Patient Health Questionnaire-9), their health conditions had a greater perceived impact on home management (measured by SIP-HM, an independent category of the SIP) and on recreation/pastimes (measured by the SIP-RP, an independent category of the SIP), i.e. (rxy (62) = 0.405, p<0.001; rxy(62) = 0.372, p<0.001), respectively.
Discussion
Our study sought to identify correlations between the psychosocial risk factors of pain-related disability and symptom profile factors and the perceived impact of their health conditions on the performance of daily activities based on the behavioural indicators (perceived occupational performance) of veterans referred for interdisciplinary rehabilitation. We found that among the sample of 64 veterans (client files) included in this study, higher scores for perceived disability, catastrophising, injustice/unfairness, and fear of movement were associated with a more severe perceived impact of their health conditions on their occupational performance in meaningful daily life activities such as home management and recreation/ pastimes. We also found a strong correlation between home management and recreation/pastimes associated with more symptoms of fatigue and pain, and more severe symptoms of depression in these veterans.
Our results can be explained according to the Fear- Avoidance Model of Pain and Disability.10,11 According to this model, fear of movement often correlates with avoidance of any activities associated with pain. Our results support the findings from previous scholars, i.e. pain-related fear has consistently been associated with more severe disability11. Compounding this, avoidance of situational and environmental triggers is common among veterans affected by PTSD, further potentiating depression and decreased engagement in everyday activities and roles. In addition, the Veterans’ Identities Research Theme Working group31 states that, although only a small number of veterans encounter difficulties transitioning to civilian life, ‘identities can be injured or nurtured during military-civilian transition’. Veterans who have been medically (involuntarily) discharged and those who have chronic health problems face additional challenges. In addition, avoidance of situational and environmental triggers is common among veterans affected by PTSD.
Avoidance behaviours due to pain and PTSD cause further depression and disabilities. Activity participation and reduced fear of pain are considered key elements in effectively managing individuals with chronic health and mental health conditions who experience high levels of catastrophic thinking and fear of movement.15 For example, Plagge and colleagues explored the clinical effectiveness and feasibility of an intervention utilising collaborative care components and behavioural activation to treat chronic pain and PTSD.34 The participants showed significant improvements in measures of PTSD, pain severity and pain interference, as well as in measures of mental health conditions and quality of life.
The results of our study expand and further illuminate the work of earlier researchers. Psychosocial factors are strongly correlated with disability in a wide range of medical and mental health conditions, specifically pain-related disability. Our study’s findings clarify the intricate make-up of the psychosocial phenomena that correlate to veterans’ singular statements of inability and shine a spotlight on the affected performance of domestic and recreational activities.
| 1 | 2 | 3 | 4 | 5 | 6 | 7 | 8 | 9 | 10 | 11 | 12 | 13 | 14 | 15 | 16 | 17 | 18 | 19 | 20 | 21 | ||
|---|---|---|---|---|---|---|---|---|---|---|---|---|---|---|---|---|---|---|---|---|---|---|
| 1 | Age (in years) | 1.000 | 0.204 | 0.070 | -0.122 | 0.132 | 0.662** | -0.112 | -0.189 | -0.186 | -0.079 | 0.064 | 0.097 | -0.157 | 0.156 | -0.146 | -0.224 | -0.100 | -0.022 | -0.114 | -0.001 | -0.077 |
| 2 | Gender | 1.000 | 0.000 | -0.092 | 0.173 | 0.112 | 0.003 | -0.204 | -0.114 | -0.144 | 0.132 | -0.195 | -0.254* | -0.046 | -0.221 | -0.211 | -0.090 | -0.170 | -0.161 | 0.009 | -0.221 | |
| 3 | Body Mass Index-BMI | 1.000 | -0.050 | 0.004 | 0.034 | 0.136 | -0.024 | -0.164 | -0.055 | 0.138 | -0.189 | 0.085 | 0.211 | 0.276* | 0.193 | -0.240 | 0.143 | 0.271* | 0.254* | 0.328** | ||
| 4 | Marital status | 1.000 | -0.137 | -0.165 | -0.056 | 0.158 | -0.032 | 0.196 | -0.057 | 0.073 | -0.058 | 0.099 | -0.025 | 0.089 | 0.091 | -0.098 | -0.075 | -0.055 | -0.007 | |||
| 5 | Highest level of education completed | 1.000 | -0.039 | -0.036 | 0.022 | 0.033 | 0.230 | -0.005 | -0.164 | 0.016 | -0.126 | -0.041 | -0.039 | -0.037 | 0.012 | 0.005 | 0.182 | -0.031 | ||||
| 6 | Length of service (in years) | 1.000 | -0.098 | -0.313* | -0.199 | -0.152 | -0.151 | -0.031 | -0.226 | 0.140 | -0.214 | -0.257* | -0.024 | -0.062 | -0.199 | -0.035 | -0.151 | |||||
| 7 | Disability Index (Perceived disability, GPDI) | 1.000 | 0.213 | 0.357** | 0.262* | 0.380** | 0.287* | 0.585** | 0.653** | 0.428** | 0.350** | 0.117 | 0.171 | 0.506** | 0.360** | 0.602** | ||||||
| 8 | Perception of Injustice (Perceived injustice, CIEQ-I) | 1.000 | 0.707** | 0.582** | 0.410** | 0.165 | 0.473** | 0.364** | 0.473** | 0.455** | 0.206 | 0.165 | 0.242 | 0.197 | 0.525** | |||||||
| 9 | Perception of Catastrophizing (Catastrophic thoughts, CIEQ-C) | 1.000 | 0.559** | 0.465** | 0.234 | 0.530** | 0.233 | 0.461** | 0.257* | 0.239 | 0.002 | 0.158 | 0.242 | 0.439** | ||||||||
| 10 | Fear of movement (Exacerbating symptoms (or Fear of movement), FFQ-K) | 1.000 | 0.290* | 0.089 | 0.377** | 0.423** | 0.311* | 0.169 | 0.138 | 0.041 | 0.064 | 0.264* | 0.396** | |||||||||
| 11 | Fatigue (FFQ-F) | 1.000 | 0.352** | 0.570** | 0.290** | 0.515** | 0.370** | 0.101 | 0.116 | 0.318* | 0.380** | 0.515** | ||||||||||
| 12 | Pain symptoms (McGill Pain Questionnaire (short form), MPQ-SF) | 1.000 | 0.257* | 0.238 | 0.144 | 0.247 | 0.098 | 0.017 | 0.083 | -0.153 | 0.179 | |||||||||||
| 13 | Severity of depressive symptoms (Patient Health Questionnaire-9, PHQ-9) | 1.000 | 0.452** | 0.629** | 0.369** | 0.269* | 0.115 | 0.405** | 0.372** | 0.669** | ||||||||||||
| 14 | Sickness Impact Profile (Physical dimension score, SIP-PD) | 1.000 | 0.358** | 0.342** | 0.165 | 0.162 | 0.470** | 0.300* | 0.656** | |||||||||||||
| 15 | Sickness Impact Profile (Psychosocial dimension score, SIP-PSD) | 1.000 | 0.500** | .203 | .203 | 0.323** | 0.500** | 0.900** | ||||||||||||||
| 16 | Sleep/rest-SIP (Independent Category SIP-SR) | 1.000 | .038 | .165 | 0.401** | 0.309* | 0.590** | |||||||||||||||
| 17 | Eating-SIP (Independent Category SIP-E) | 1.000 | .011 | 0.216 | 0.133 | 0.252* | ||||||||||||||||
| 18 | Work-SIP (Independent Category SIP-W) | 1.000 | 0.164 | 0.173 | 0.341** | |||||||||||||||||
| 19 | Home management-SIP (Independent Category SIP-HM) | 1.000 | 0.345** | 0.527** | ||||||||||||||||||
| 20 | Recreation/pastimes-SIP (Independent Category SIP-RP) | 1.000 | 0.596** | |||||||||||||||||||
| 21 | Sickness Impact Profile (Overall Score, SIP-O) | 1.000 |
* p < 0.05, ** p<0.01, n= 64
Thus, using the CMOP-E, we not only affirm that it produces the expected correlations, but it guides clinicians in a multidisciplinary practice to tailor services within the context of veterans’ distinct institutional and cultural environments, not a consideration when using a symptom-oriented treatment approach.
With the dissolution of the prior identity as a serving member of the military (one aspect of ‘spirituality’ at the centre of the CMOP-E) and the associated job loss (‘productivity’ in the CMOP-E), roles such as home management and recreation/pastimes take on greater salience, becoming sources of meaningful engagement for veterans who have not found a new vocational identity. Rehabilitation goals focused on increasing veterans’ confidence and satisfaction in these roles may be a starting point for reframing their life’s purpose, finding a new reason to get up every day and experience ‘doing’. For the small proportion of veterans who do not make a seamless transition to a civilian job or permanent disability status, finding new sources of meaning and purpose in life through their daily activities is an important step in their rehabilitation.
As a secondary analysis, this study has some limitations. First, we analysed a sample of n = 64 out of 250 clinical files at this particular unique clinic, thus effectively limiting the generalisability of the study to other clinical settings. The second important limitation was that we conducted simple bivariate correlations that do not control for other variables. As result, spurious correlations cannot be ruled out, since no demographic or other medical variables were considered in the analysis. The sample size was insufficient for conducting more complex regression analyses; therefore, future research with larger sample sizes should be conducted in order to avoid this insufficiency.
Future studies will examine the effectiveness of our individualised rehabilitation service model with Canadian veterans, and will explore the cultural, institutional and environmental factors that are salient when working with a Canadian veteran population.
Our findings have the following implications for care management and rehabilitation for Canadian veterans: The data strongly confirm and add substance to what contributes to the intricate presentation by this sample of veterans, thus providing a possible explanation of why progress in this population is elusive in multiple single-discipline symptomatic treatments. Furthermore, the highly personalised approach of the OPAU’s clinicians put the veterans’ perspective in focus through considering the context of their needs and the demands of their roles.
Conclusion
The findings from this sample of Canadian veterans at high risk of pain-related disability with severe pain and depressive phenomena serve to enlighten clinicians’ understanding of the interplay and relationship of psychosocial and symptom profile variables as risk factors for prolonged disability. The latter contribute to the perception of a greater understanding of their overall health status, their impairments, and their performance of daily life activities (occupations), particularly household tasks and recreation and leisure pastimes. The CMOP-E’s constructs guide the collaborative multidisciplinary assessment process and the exploration of veterans’ occupational performance within the broader context of their personal environment. By revealing the full range of their daily life activities, some strengths (the performance of activities they do not avoid) emerge. These strengths can become ‘doing’ facilitators in gradually broadening veterans’ engagement in activities and lessening their more intense preoccupations on pain limiting symptoms and, most importantly, in perceiving achieving new goals related to home and leisure pursuits as their new ‘mission’.
Supplemental material. Appendix A
Table A.1: General health indicators, by Rank Group
| Indicator | Category | N | Officer (1.6%) | Non- Officer (98.4%) | Regular Force (100%) |
|---|---|---|---|---|---|
| Suicidal ideation | Suicidal ideation (Yes) | 4 | 0% | 6.3% | 6.2% |
| Suicidal ideation (No) | 60 | 100% | 93.7% | 93.8% | |
| Hearing problem | Hearing problem (Yes) | 32 | 0% | 50.8% | 50% |
| Hearing problem (No) | 32 | 100% | 49.2% | 50% | |
| Chronic pain | Chronic pain (Yes) | 58 | 0% | 92.1% | 90.6% |
| Chronic pain (No) | 6 | 100% | 7.9% | 9.4% | |
| Back problems | Back problems (Yes) | 54 | 100% | 84.1% | 84.4% |
| Back problems (No) | 10 | 0% | 15.9% | 15.6% | |
| Arthritis | Arthritis (Yes) | 20 | 100% | 30.2% | 31.3% |
| Arthritis (No) | 44 | 0% | 69.8% | 68.8% | |
| High blood pressure | High blood pressure (Yes) | 10 | 0% | 15.9% | 15.6% |
| High blood pressure (No) | 54 | 100% | 84.1% | 84.4% | |
| Mood disorder | Mood disorder (Yes) | 53 | 0% | 84.1% | 82.8% |
| Mood disorder (No) | 11 | 100% | 15.9% | 17.2% | |
| Anxiety disorder | Anxiety disorder (Yes) | 49 | 0% | 77.8% | 76.6% |
| Anxiety disorder (No) | 15 | 100% | 22.2% | 23.4% | |
| PTSD | PTSD (Yes) | 34 | 0% | 54% | 53.1% |
| PTSD (No) | 30 | 100% | 46% | 46.9% | |
| Migraine headaches | Migraine headaches (Yes) | 23 | 100% | 34.9% | 35.9% |
| Migraine headaches (No) | 41 | 0% | 65.1% | 64.1% | |
| Diabetes | Diabetes (Yes) | 8 | 0% | 12.7% | 12.5% |
| Diabetes (No) | 56 | 100% | 87.3% | 87.5% | |
| Bowel disorder | Bowel disorder (Yes) | 10 | 0% | 15.9% | 15.6% |
| Bowel disorder (No) | 54 | 100% | 84.1% | 84.4% | |
| Asthma | Asthma (Yes) | 8 | 0% | 12.7% | 12.5% |
| Asthma (No) | 56 | 100% | 87.3% | 87.5% | |
| Heart disease | Heart disease (Yes) | 4 | 0% | 6.3% | 6.2% |
| Heart disease (No) | 60 | 100% | 93.7% | 93.8% | |
| Intestinal or stomach ulcers | Intestinal or stomach ulcers (Yes) | 5 | 100% | 6.3% | 7.8% |
| Intestinal or stomach ulcers (No) | 59 | 0% | 93.7% | 92.2% | |
| Urinary incontinence | Urinary incontinence (Yes) | 5 | 100% | 6.3% | 7.8% |
| Urinary incontinence (No) | 59 | 0% | 93.7% | 92.2% | |
| Traumatic Brain Injury-TBI | Traumatic Brain Injury-TBI (Yes) | 1 | 0% | 1.6% | 1.6% |
| Traumatic Brain Injury-TBI (No) | 63 | 100% | 98.4% | 98.4% | |
| Concussions | Concussions (Yes) | 16 | 0% | 25.4% | 25% |
| Concussions (No) | 48 | 100% | 74.6% | 75% | |
| Cancer (current) | Cancer (current) (Yes) | 0 | 0% | 0% | 0% |
| Cancer (current) (No) | 64 | 100% | 100% | 100% | |
| Cancer (prior) | Cancer (prior) (Yes) | 0 | 0% | 0% | 0% |
| Cancer (prior) (No) | 64 | 100% | 100% | 100% | |
| Chronic bronchitis, or chronic obstructive pulmonary disease (COPD) and Sleep apnoea | Chronic bronchitis, or chronic obstructive pulmonary disease (COPD) and Sleep apnoea (Yes) | 10 | 0% | 15.9% | 15.6% |
| Chronic bronchitis, or chronic obstructive pulmonary disease (COPD) and Sleep apnoea (No) | 54 | 100% | 84.1% | 84.4% | |
| Stroke | Stroke (Yes) | 0 | 0% | 0% | 0% |
| Stroke (No) | 64 | 100% | 100% | 100% | |
| Dementia | Dementia (Yes) | 0 | 0% | 0% | 0% |
| Dementia (No) | 64 | 100% | 100% | 100% | |
| Repetitive strain injuries | Repetitive strain injuries (Yes) | 8 | 0% | 12.7% | 12.5% |
| Repetitive strain injuries (No) | 56 | 100% | 87.3% | 87.5% | |
| Rheumatic/Autoimmune disease | Rheumatic/Autoimmune disease (Yes) | 4 | 0% | 6.3% | 6.2% |
| Rheumatic/Autoimmune disease (No) | 60 | 100% | 93.7% | 93.8% | |
| Musculoskeletal | Musculoskeletal (Yes) | 61 | 0% | 96.8% | 95.3% |
| Musculoskeletal (No) | 3 | 100% | 3.2% | 4.7% | |
| Jaw/Facial/Dental | Jaw/Facial/Dental (Yes) | 13 | 0% | 20.6% | 20.3% |
| Jaw/Facial/Dental (No) | 51 | 100% | 79.4% | 79.7% | |
| Other health condition | Other health condition (Yes) | 4 | 0% | 6.3% | 6.2% |
| Other health condition (No) | 60 | 100% | 93.7% | 93.8% |
Corresponding Author: Antonio Miguel Miguel-Cruz, miguelcr@ualberta.ca
Authors: AM Miguel-Cruz1, S Brintnell1, M Roxburgh1, J Guevara Salamanca1, L Liu2
Author Affiliations:
1 University of Alberta – Occupational Therapy
2 University of Waterloo – Faculty of Health