
Abstract
Background: The acquisition of normative percentile values for fitness could help understand fitness progression in relation to age and grade level and establish cut-off points for low fitness levels in a military population.
Purpose: To establish specific normative reference values by gender and academic year over five physical fitness tests taken by naval school cadets, using a nationally representative sample.
Materials and methods: 289 students enrolled in the military/civil bachelor’s degree at the Naval Military Academy in Marin (265 male and 24 female) participated in this study. The design used was a descriptive- correlational cross-sectional study. Body composition data and results from the Spanish army physical fitness assessment system (2 min push-ups, 1000 m and 50 m races, vertical jump and 50 m swimming) were used. To establish normative values based on gender and the academic year in which the student officers of the Naval Academy are found, percentiles were identified for each of the components of physical fitness and morphology.
Results: The findings provide normative data on naval military cadets’ physical condition and body composition by gender and academic year. The results showed that men performed better than women in speed (50 m running), upper and lower extremity strength, and cardiorespiratory fitness. Additionally, the results indicate that the higher the academic year, the better the physical condition.
Conclusion: These values are useful in the evaluation of this population and provide objective data regarding the maintenance of high levels of physical fitness and for the identification of individual training needs.
Keywords: Physical fitness; Normative values; BMI; Military personnel.
Introduction
The ability of members of the military to develop and maintain high levels of fitness is crucial to their success in the different demands of their jobs.1,2 The most generalised method in different military environments worldwide for evaluating soldiers’ physical fitness is the Basic Physical Condition Assessment, which combines evaluation of physical capacity with specific demands of the military work.3 Normative data adjusted for age and sex are available in many countries.3,4 These values allow the performance of an individual soldier to be understood when compared to a reference population.
The Uniformed Services University of Health Sciences hosted a conference in June 2006 where several key issues were identified, including ‘developing valid and standardised metrics for military personnel’.5 Normative percentile values for fitness, specific to a military population, could be helpful in developing a better understanding of fitness progression with age/grade level and could also help to inform the cut-off points established for low fitness levels over all academic years and by gender. In addition, objective measurements in an active population that undergoes year-round military training are important in determining individual fitness levels and in evaluating training programs.6
Normative data on physical capabilities are available, though this data focuses on athletes and other specialised populations and does not specifically identify with the military population.7-9
Few studies have produced normative data in military populations, and these are mainly oriented towards the risk of injury,10,11 and cognitive aspects.12,13 To our knowledge, no studies have been published generally for a comprehensive set of physical fitness tests in a military population, nor specifically in a Spanish military population. In addition, when dealing with the military population, it is important to understand that, among the different armed forces—land, sea and air—cadets and future military professionals present different demands both during the officer training stage and after graduation from different positions reached by cadets. The Spanish Navy has 13 training academies that lead to different command posts. The Naval Military Academy of Marin is only for Naval officers, and it is currently composed of 475 students.
Therefore, the main objective of our study was to present normative reference values for five measures of physical fitness (1000 m, 50 m sprint, push-ups, vertical jump test and 50 m swimming) and of body composition through the body mass index (BMI), by gender and over the whole course of the subjects’ academic training (academic years) in one of the most important naval academies in Spain.
Methods
Study design
This study was carried out with a quantitative approach, the type of research was descriptive- correlational with a cross-sectional component, and primary and secondary sources of information were used.
Participants
The study population consisted of 475 Spanish officer students (Male 92%; Female 8%). The sample comprises students who were enrolled in the military/ civil degree at the Naval Military Academy of Marin attached to the University of Vigo, during the 2018/2019 academic year. The recruitment period lasted from January to May 2019. Therefore, this study is descriptive to establish a frame of reference from which to work in relation to future officers’ physical and morphological condition during their training at naval academies in Spain.
Based on a finite population of cadets who were enrolled in the Naval Military Academy of Marin, a calculation of the sample size was carried out. A total population of 475 student officers was considered, with a confidence level of 95%, a precision level of 98%, a proportion of 7% and an expected loss of 6%, resulting in a sample size of 287 student officers (23 females and 264 male).
As inclusion criteria, it was necessary for the cadets to remain active during the data collection process and to fully comply with all physical assessment tests. As exclusion criteria, any cadets who presented injuries that prevented them from carrying out their training during the academic year were not included.
All cadets who volunteered gave their informed written consent. This study complies with the Declaration of Helsinki regarding the treatment and collection of data.14 The project was approved by the Ethics Committee of the Faculty of Education and Sports Sciences of the University of Vigo, whose code is CE: 03-719.
Data collection and measurements
The data collection took place locally at the Naval Military Academy (Marin, Spain) at three different locations: on an athletics track (50 m and 1000 m), in a multipurpose room (vertical jump and push- ups), and a swimming pool (50 m swimming).
The same two test leaders conducted the testing during the study, using the same protocols and equipment over all the data collection periods. Testing was conducted over one week in May, in the morning before breakfast (6:00–7:30 a.m.), with the cadets having fasted overnight. The participants were allowed to drink water before testing. On the first day, the endurance tests (1000 m run) were carried out; on the second day, the swimming test; on the third day, the push-ups and vertical jump and on the fourth day, the 50 m sprint test. The subjects who could not attend on any of the previous days were tested on the fifth day. The anthropometric assessment (weight and height) was carried out in the multipurpose room over the five days before testing. Before carrying out the physical tests, the participants performed 15 minutes of specific warm- ups, oriented towards the physical condition tests that were going to be carried out. The physical condition evaluations were carried out by the same test leaders and physical education teachers from the Naval Academy who conducted these assessments for at least 2 years. The International Working Group of Kinanthropometry (ISAK) technicians carried out the anthropometric assessments.
A basic anthropometric assessment of weight (kg), height (m) and BMI was recorded. The anthropometric measurements followed the protocols of the ISAK 15. Height was measured using a stadiometer (Model HR001, Tanita Corp., Amsterdam, Netherlands) to the nearest 5mm. Weight was measured using a Tanita (Model TBF300, Tanita Corp., Amsterdam, Netherlands) to the nearest 0.1kg. BMI was calculated by dividing weight by height squared (kg/m2).
For the evaluation of physical capacity, the Sistema de Evaluación Física del Ejército de Tierra (SEFIET) was used. This evaluation allows an individual physical profile (IPP) to be defined, composed of three digits corresponding to the levels achieved in each of the three traits or groups of physical qualities (strength, stamina and speed). A Physical Condition Assessment (PCA)16 was carried out, including the five tests (push-ups, 1000 m running, 50 m running, vertical jump, 50 m swimming) described before.
2-minute push-ups: Maximum amount of push- ups completed from a 90° elbow flexion position with hands and tips of toes on the floor. Push-up repetitions were recorded for 2 minutes.
1000-metre race: The race started in the standing position (one foot placed in front of the body, pointing directly towards the track; the other foot is placed back with the heel off the ground; and the body is slightly inclined forward) and after the ‘ready and go’ verbal command. The athletics track was clay with an extension of 400 m in ellipse format. The times taken to complete 1000 m were recorded in minutes and seconds. Times were recorded to an accuracy of a split second.
50-metre race: The race starts from the standing position and after the ‘ready and go’ verbal command as previously described. Time was recorded in seconds.
Vertical jump: The participants must establish their starting position by standing at 90° to a wall, with feet shoulder-width apart and arms with 180° shoulder flexion. The participant then performs a vertical jump (in two attempts) using the squat jump (SJ) test, their fingertips touching as high as possible on a ruled surface placed on the wall.
50-metre swim: The race starts in a standing position, and after the ‘ready and go’ verbal command, participants dive into the water from the edge. The distance must be completed using freestyle. Time was measured in seconds to an accuracy of a split second.
Table 1. Means and SD for physical fitness and morphological component normative values among Spanish Navy students
| All (n=289) | Hombre (n=265) | Female (n=24) | |||||
|---|---|---|---|---|---|---|---|
| mean | sd | CI (95%) | mean | sd | mean | sd | |
| Age (years) | 21,86 | 3,50 | 21,49 to 22,33 | 21,77 | 3,30 | 22,83 | 5,22 |
| Height (cm) | 176,10 | 7,53 | 175,34 to 177,13 | 177,16 | 6,81 | 164,50 | 4,83 |
| Weight (Kg) | 73,41 | 9,18 | 72,37 to 74,60 | 74,60 | 8,49 | 60,36 | 5,82 |
| BMI (kg/m2) | 23,63 | 2,17 | 23,35 to 23,88 | 23,75 | 2,14 | 22,33 | 2,21 |
| 1000 m running (min) | 03:22,98 | 00:15,51 | 03:21,12 to 03:24,83 | 03:20,40 | 00:12,47 | 03:53,57 | 00:15,99 |
| 50 m running (s) | 6,95 | 0,49 | 6,88 to 6,99 | 6,86 | 0,37 | 8,01 | 0,50 |
| Push-ups (reps) | 42,65 | 11,11 | 41,37 to 44,04 | 43,69 | 10,54 | 29,25 | 9,49 |
| Vertical jump (cm) | 55,22 | 6,65 | 54,53 to 56,11 | 56,19 | 5,79 | 43,15 | 4,70 |
| 50 m swimming (s) | 37,78 | 6,01 | 37,13 to 38,58 | 37,23 | 5,64 | 45,05 | 5,80 |
Data analysis
Descriptive statistics were generated for all study variables. The descriptive analysis was carried out globally and by stratifying the sample according to gender. The descriptive analysis was carried out using measures of central tendency (mean, standard deviations) and confidence interval. Graphic representations were made of each variable analysed, referencing the percentiles 10, 25, 50, 75 and 95 to analyse the behaviour of the variables under study over the 5 years of training. The significance level was set at P<0.05. Statistical analyses were performed in IBM-SPSS v.25 (IBM Co., Armonk, NY).
Results
Two-hundred and eighty-nine Spanish military cadets with a mean age of 21.86±3.5 years, 176,1±7,53 average height and 73,41±9,18 average body weight, participated in this study. The participation rate was higher than 96.3% of the enrolled students. The mean values of the military population are shown in Table 1. The number of military women is much lower than the number of men, and they have a higher average age. In the variables analysed (anthropometric and BMI), women present lower results than those recorded for men.
Tables 2 and 3 provide normative values as tabulated percentiles from 10% to 95% for the five fitness tests and for BMI, by gender and academic year, respectively.
Table 2. Percentile values summary statistics by gender among Spanish Navy students: Physical fitness and morphological component
| n | Percentiles | ||||||||||||
|---|---|---|---|---|---|---|---|---|---|---|---|---|---|
| 10 | 20 | 25 | 30 | 40 | 50 | 60 | 70 | 75 | 80 | 90 | 95 | ||
| All same | |||||||||||||
| BMI (kg/m2) | 289 | 20,15 | 21,25 | 21,68 | 22,00 | 22,50 | 22,90 | 23,25 | 23,80 | 24,23 | 24,75 | 26,15 | 27,76 |
| 1000 m running (min) | 271 | 03:16,70 | 03:22,00 | 03:23,70 | 03:25,50 | 03:29,40 | 03:33,70 | 03:37,60 | 03:41,40 | 03:42,90 | 03:44,00 | 03:54,20 | 03:58,80 |
| 50 m running (s) | 269 | 7,03 | 7,34 | 7,38 | 7,41 | 7,52 | 7,62 | 7,70 | 7,80 | 7,84 | 7,96 | 8,11 | 8,27 |
| Push-ups (reps) | 269 | 52,05 | 49,20 | 44,40 | 43,38 | 42,35 | 39,00 | 35,75 | 33,50 | 29,95 | 27,25 | 25,20 | 21,60 |
| Vertical jump (cm) | 269 | 57,73 | 56,15 | 55,00 | 54,25 | 52,95 | 51,50 | 49,50 | 48,10 | 46,55 | 45,88 | 45,50 | 42,45 |
| 50 m swimming (s) | 269 | 34,45 | 36,50 | 36,83 | 37,30 | 38,90 | 41,00 | 42,50 | 43,50 | 44,30 | 45,30 | 47,50 | 49,18 |
| Men | |||||||||||||
| BMI (kg/m2) | 265 | 21,15 | 21,80 | 22,02 | 22,45 | 23,20 | 23,65 | 24,20 | 24,75 | 25,20 | 25,50 | 26,55 | 27,77 |
| 1000 m running (min) | 249 | 03:00,30 | 03:05,00 | 03:08,00 | 03:10,00 | 03:13,00 | 03:17,00 | 03:20,00 | 03:25,00 | 03:27,00 | 03:28,40 | 03:35,70 | 03:39,00 |
| 50 m running (s) | 249 | 6,65 | 6,80 | 6,86 | 6,90 | 7,00 | 7,09 | 7,19 | 7,30 | 7,31 | 7,40 | 7,50 | 7,66 |
| Push-ups (reps) | 249 | 63,00 | 58,00 | 54,80 | 53,00 | 52,00 | 48,00 | 43,50 | 41,00 | 39,30 | 36,00 | 33,00 | 27,80 |
| Vertical jump (cm) | 249 | 65,95 | 63,00 | 61,00 | 60,00 | 59,00 | 57,00 | 55,00 | 53,40 | 52,00 | 51,50 | 51,00 | 47,00 |
| 50 m swimming (s) | 249 | 31,70 | 33,00 | 33,25 | 34,00 | 35,00 | 37,00 | 38,00 | 39,00 | 40,00 | 41,00 | 45,00 | 48,00 |
| Women | |||||||||||||
| BMI (kg/m2) | 24 | 19,15 | 20,70 | 21,35 | 21,55 | 21,80 | 22,15 | 22,30 | 22,85 | 23,25 | 24,00 | 25,75 | 27,75 |
| 1000 m running (min) | 22 | 03:33,20 | 03:39,00 | 03:39,50 | 03:41,00 | 03:45,80 | 03:50,50 | 03:55,20 | 03:57,80 | 03:58,75 | 03:59,60 | 04:12,80 | 04:18,60 |
| 50 m running (s) | 20 | 7,40 | 7,87 | 7,90 | 7,91 | 8,04 | 8,15 | 8,21 | 8,29 | 8,37 | 8,52 | 8,72 | 8,88 |
| Push-ups (reps) | 20 | 41,10 | 40,40 | 34,00 | 33,75 | 32,70 | 30,00 | 28,00 | 26,00 | 20,60 | 18,50 | 17,40 | 15,40 |
| Vertical jump (cm) | 20 | 49,50 | 49,30 | 49,00 | 48,50 | 46,90 | 46,00 | 44,00 | 42,80 | 41,10 | 40,25 | 40,00 | 37,90 |
| 50 m swimming (s) | 20 | 37,20 | 40,00 | 40,40 | 40,60 | 42,80 | 45,00 | 47,00 | 48,00 | 48,60 | 49,60 | 50,00 | 50,35 |
Table 3. Percentile values summary statistics by academic level among Spanish Male Navy Students: Physical fitness and morphological component
| n | Percentiles | ||||||||||||
|---|---|---|---|---|---|---|---|---|---|---|---|---|---|
| 10 | 20 | 25 | 30 | 40 | 50 | 60 | 70 | 75 | 80 | 90 | 95 | ||
| 1º Level | |||||||||||||
| BMI (kg/m2) | 73 | 20,62 | 21,40 | 21,55 | 21,74 | 22,36 | 23,30 | 23,64 | 24,18 | 24,25 | 24,60 | 26,32 | 27,30 |
| 1000 m running (min) | 73 | 03:08,10 | 03:13,00 | 03:15,500 | 03:17,10 | 03:21,80 | 03:25,00 | 03:27,00 | 03:29,90 | 03:32,00 | 03:36,20 | 03:44,30 | 03:56,90 |
| 50 m running (s) | 73 | 6,50 | 6,60 | 6,70 | 6,80 | 7,00 | 7,10 | 7,20 | 7,30 | 7,40 | 7,50 | 7,80 | 8,20 |
| Push-ups (reps) | 73 | 55,00 | 54,00 | 51,00 | 50,00 | 46,00 | 44,00 | 41,00 | 39,00 | 36,00 | 34,00 | 31,00 | 22,00 |
| Vertical jump (cm) | 73 | 62,00 | 58,00 | 55,00 | 55,00 | 55,00 | 52,00 | 51,00 | 50,00 | 49,00 | 47,00 | 46,00 | 44,00 |
| 50 m swimming (s) | 73 | 32,60 | 35,00 | 35,50 | 36,00 | 37,00 | 38,00 | 39,00 | 40,00 | 41,00 | 43,80 | 48,40 | 59,30 |
| 2º Level | |||||||||||||
| BMI (kg/m2) | 50 | 20,76 | 21,50 | 21,60 | 21,80 | 22,50 | 23,00 | 23,20 | 24,00 | 24,30 | 24,68 | 25,70 | 26,58 |
| 1000 m running (min) | 45 | 03:02,00 | 03:11,00 | 03:12,00 | 03:13,00 | 03:19,00 | 03:21,50 | 03:25,00 | 03:29,00 | 03:30,00 | 03:32,00 | 03:44,00 | 04:10,00 |
| 50 m running (s) | 45 | 6,40 | 6,50 | 6,57 | 6,60 | 6,65 | 6,70 | 6,80 | 6,90 | 7,00 | 7,10 | 7,80 | 8,20 |
| Push-ups (reps) | 45 | 63,00 | 60,00 | 56,00 | 53,00 | 51,00 | 49,00 | 42,00 | 41,00 | 37,00 | 36,00 | 35,00 | 28,00 |
| Vertical jump (cm) | 45 | 69,00 | 66,00 | 62,00 | 61,00 | 60,00 | 58,00 | 57,00 | 56,00 | 54,00 | 52,00 | 51,00 | 44,00 |
| 50 m swimming (s) | 45 | 30,00 | 32,00 | 32,50 | 33,00 | 36,00 | 37,00 | 39,00 | 40,00 | 41,00 | 41,50 | 44,00 | 45,50 |
| 3º Level | |||||||||||||
| BMI (kg/m2) | 44 | 21,20 | 21,80 | 22,23 | 22,39 | 23,06 | 23,65 | 23,98 | 24,52 | 25,30 | 25,50 | 26,00 | 28,40 |
| 1000 m running (min) | 40 | 03:08,80 | 03:14,80 | 03:15,00 | 03:18,00 | 03:20,00 | 03:22,00 | 03:24,00 | 03:26,30 | 03:28,00 | 03:31,00 | 03:34,60 | 03:41,50 |
| 50 m running (s) | 40 | 6,38 | 6,40 | 6,45 | 6,50 | 6,60 | 6,70 | 6,80 | 6,90 | 7,00 | 7,10 | 7,40 | 7,60 |
| Push-ups (reps) | 40 | 60,00 | 58,00 | 50,00 | 48,00 | 45,00 | 41,00 | 40,00 | 37,00 | 33,00 | 30,00 | 30,00 | 29,00 |
| Vertical jump (cm) | 40 | 70,00 | 65,00 | 63,00 | 61,00 | 60,00 | 60,00 | 58,00 | 57,00 | 56,00 | 55,00 | 54,00 | 50,00 |
| 50 m swimming (s) | 40 | 31,90 | 33,00 | 33,70 | 34,70 | 36,00 | 38,00 | 39,40 | 40,00 | 41,00 | 41,50 | 44,50 | 54,10 |
| 4º Level | |||||||||||||
| BMI (kg/m2) | 57 | 20,72 | 22,00 | 22,10 | 22,46 | 23,60 | 24,10 | 24,92 | 25,22 | 25,50 | 26,10 | 27,30 | 28,00 |
| 1000 m running (min) | 54 | 02:59,60 | 03:06,40 | 03:09,20 | 03:11,00 | 03:14,20 | 03:19,00 | 03:22,00 | 03:23,10 | 03:25,00 | 03:27,00 | 03:29,70 | 03:33,40 |
| 50 m running (s) | 54 | 6,33 | 6,50 | 6,55 | 6,60 | 6,70 | 6,90 | 6,95 | 7,00 | 7,10 | 7,20 | 7,40 | 7,50 |
| Push-ups (reps) | 54 | 63,00 | 60,00 | 55,00 | 54,00 | 50,00 | 45,00 | 43,00 | 40,00 | 39,00 | 34,00 | 33,00 | 30,00 |
| Vertical jump (cm) | 54 | 68,00 | 66,00 | 62,00 | 61,00 | 60,00 | 59,00 | 58,00 | 57,00 | 56,00 | 55,00 | 54,00 | 53,00 |
| 50 m swimming (s) | 54 | 32,00 | 33,00 | 33,50 | 34,00 | 35,20 | 37,00 | 38,00 | 39,00 | 39,50 | 40,40 | 44,70 | 47,30 |
| 5º Level | |||||||||||||
| BMI (kg/m2) | 41 | 21,38 | 22,50 | 23,20 | 23,34 | 23,62 | 24,20 | 24,74 | 25,38 | 25,80 | 26,14 | 27,06 | 28,35 |
| 1000 m running (min) | 37 | 02:58,60 | 03:04,20 | 03:06,00 | 03:08,80 | 03:12,80 | 03:16,00 | 03:17,60 | 03:19,00 | 03:19,00 | 03:21,60 | 03:27,80 | 03:42,00 |
| 50 m running (s) | 37 | 6,36 | 6,42 | 6,50 | 6,55 | 6,70 | 6,80 | 6,90 | 7,00 | 7,10 | 7,20 | 7,30 | 7,50 |
| Push-ups (reps) | 37 | 65,00 | 64,00 | 53,00 | 51,00 | 50,00 | 48,00 | 45,00 | 42,00 | 41,00 | 40,00 | 39,00 | 33,00 |
| Vertical jump (cm) | 37 | 67,00 | 64,00 | 62,00 | 61,50 | 61,00 | 59,00 | 57,00 | 55,00 | 53,00 | 52,00 | 51,00 | 50,00 |
| 50 m swimming (s) | 37 | 29,60 | 31,00 | 32,00 | 32,50 | 35,00 | 36,00 | 36,50 | 37,00 | 37,50 | 37,80 | 40,00 | 40,50 |
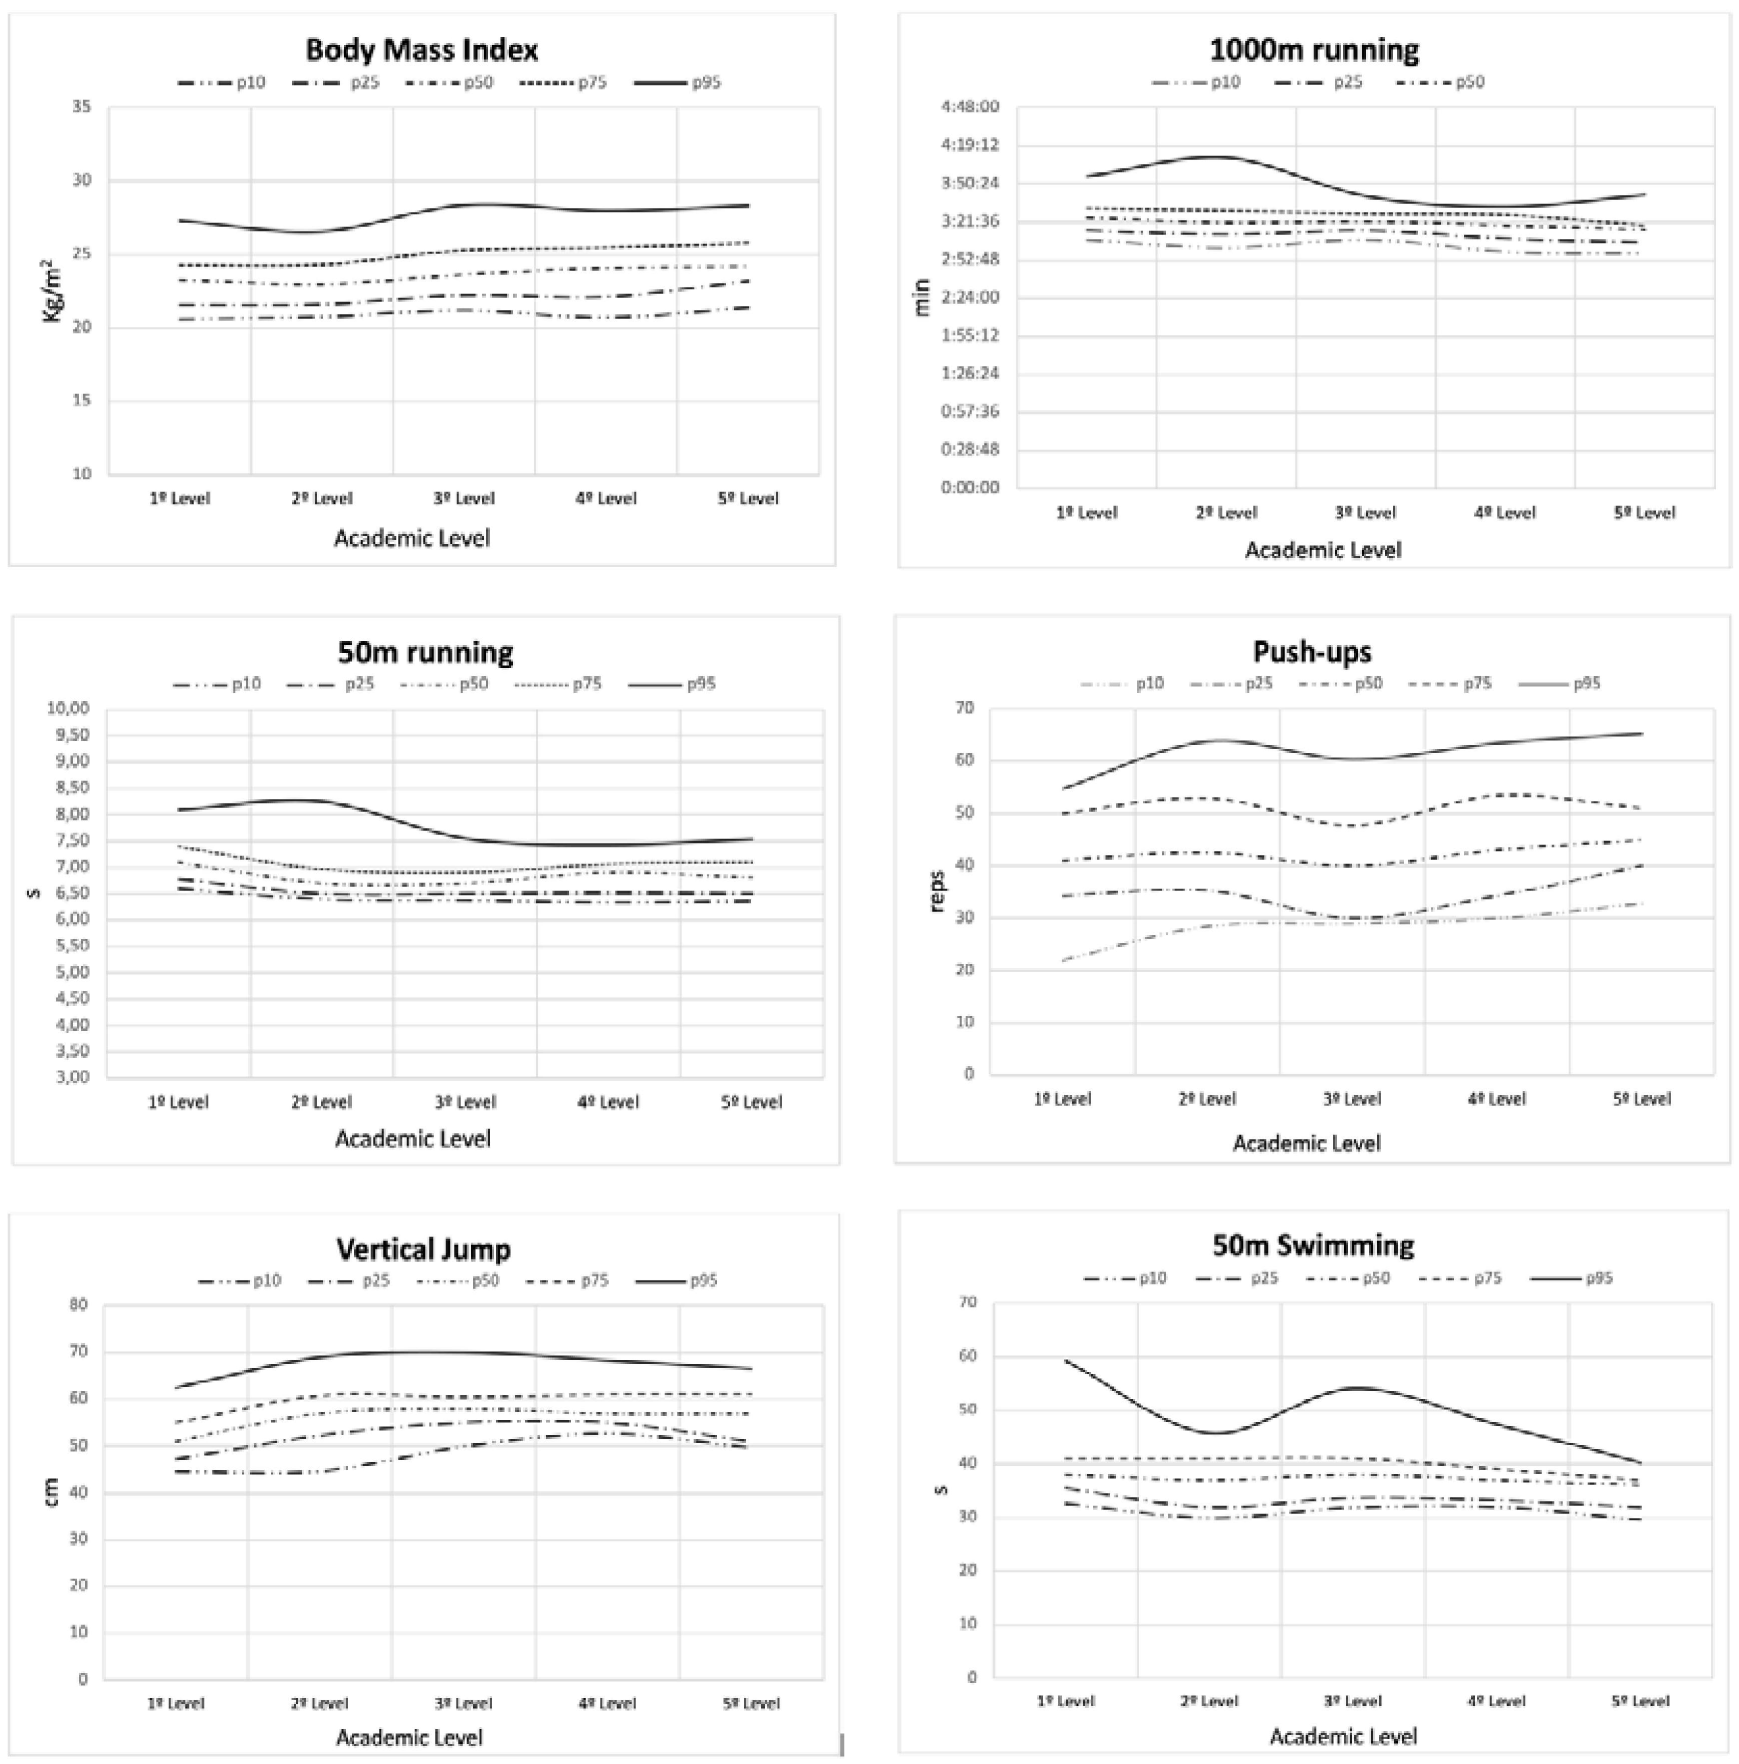
The results of all the variables analysed show that males obtain the best results. The variables of BMI, 1000 m running, push-ups and vertical jump show significant differences between P10 and P95 for both genders.
The results indicate that the higher the academic year, the better the subjects’ physical condition. The behaviour of BMI does not follow clear lines, reaching values close to those of obesity at P95. Figure 1 shows the percentile curves (P10, P25, P50, P75 y P95) of body composition and physical capacities by academic year and for males. The BMI presents a trend of higher years, higher values. For the push- ups, undulating behaviour is demonstrated by year over all percentiles (except P10). In the evaluations of running speed, the values show improvements in all percentiles from the first to the fifth year.
Discussion
The main objectives of this study were to provide reference values for general physical condition and body composition by gender and academic year among naval military students. This study attempts to establish a frame of reference from which to work in relation to the physical and morphological condition of future officers in the training stage at naval academies in Spain. Our research provides objective data to help identify individual training needs and enable comparison with other populations of similar characteristics. The results showed that men performed better than women in speed (50m running), upper and lower extremity strength, and cardiorespiratory fitness. The results also reflect an improvement in the physical condition of military personnel throughout the training process.
Figure 1. Percentile curves (P10, P25, P50, P75 and P95) of BMI and physical abilities by academic level for males.
Having normative values allows us to compare the evolution of the subjects over time and assess the need to update the conditional demands required for the performance of their professional duties. However, this is the first research study published examining a population with these characteristics. The main strength of this study, and in terms of the normative values provided here, is the strict standardisation of fieldwork (the tests and demands are the same) among the military community. However, this strength, in turn, does not allow us to compare the data of this sample with that of populations of similar age ranges (university students, athletes, etc.), since being tests designed by the Army,16 no comparative values were found.
There is some overlap in the evaluated fields (aerobic power, strength, speed) but not in the kinds of tests or tests carried out when comparing the results with evaluations of armies from other countries,17,18 with the exception of the push-up test, which is included in the evaluations of American and Australian soldiers. Regarding the values demonstrated by other military corps for the number of push-ups carried out, in the study by Pierce et al.19 of American soldiers (275 men and 46 women), both women and men presented a high mean number of repetitions. This behaviour is also observed in the study presented by Carstairs et al.3 for Australian soldiers. In the study presented by Dada et al.,6 American infantry soldiers (1573 male and 643 female) had higher mean values than those of this study. However, for other military corps (Army Soldiers in basic combat training and operational units), the mean values (4987 male and 528 female) of repetitions completed are close to our study. The results suggest the need to improve upper body strength exists for both genders since the values of P10 and P20 are those that most closely approximate the values that the other studies presented, meaning that only a small part of the sample analysed here approaches those levels of fitness.
A rising trend is recorded as the course progresses in our study regarding BMI values. However, it should be stated that this rise may be due to an increase in muscle mass since physical exercise decreases fat mass and waist circumference, as is also observed in the study by Janssen et al.20 and decreases visceral fat, as observed by Ross et al.,21 therefore, those findings could interfere with the BMI interpretation.22 In the study presented by Kyröläinen et al.,23 high BMI values were found in a military population, but also low values for stamina, whereas subjects’ physical condition improves over each academic year in this study. The study presented by Pierce et al.19 concludes that military body composition standards require a careful balance between physical performance, health and military readiness. Finally, the study by Aandstad et al.,2 with a sample of 153 Norwegian cadets, observed a rising tendency in body weight, BMI, fat-free mass and body fat percentage, in addition to an increase in muscular strength and stamina over 3 years at the academy. Statistically significant differences are not shown in such studies, but it appears that the increase in muscle power and strength occurs simultaneously as the increases in body weight, fat and BMI accordingly.
Conclusion
The findings provide normative data on naval military cadets’ physical condition and body composition by gender and academic year. These values are useful for evaluating this population and provide objective data helpful towards maintaining a high level of physical fitness and identifying the individual training needs of this population. Future research might focus on evaluating the physical condition in other Spanish naval academies and maybe try to establish a correlation between their physical condition while cadets and the demands placed on their leadership positions once they graduate.
Corresponding Author:
Helena Vila, evila@uvigo.es
Authors: H Vila1, I de Oliveira2, J Burgos-Martos3, J Cancela-Carral3
Author Affiliations:
1 Universidad de Vigo Facultad de Ciencias de la Educación y del Deporte – Special Didactics2
2 Universidade de Vigo – Department of Functional Biology and Health Services
3 Universidade de Vigo – Department of Physical Education, Military Naval Academy in Marin