
Abstract
Background: US Vietnam War Blue Water Navy veterans (BWN) conducted military operations on Vietnam’s offshore waters and likely experienced various war-related exposures. The overall health of the BWN has never been systematically studied.
Purpose: Describe and compare BWN’s health with other servicemembers and non-veterans of the Vietnam era.
Materials and methods: Survey of 45 067 randomly selected US Vietnam War theatre and non-theatre veterans and 6885 non-veterans.
Results: For 22 646 male respondents, self-reported health was contrasted by veteran status defined as BWN (n=985), theatre veterans (n=6717), non-theatre veterans (n=10 698) and non-veterans (n=4246). Exposure was service in the Vietnam War theatre. Collected were demographics, military service characteristics, lifestyle factors and health conditions. Adjusted odds ratios (aOR) were calculated using multivariable logistic regression. Controlling for cigarette smoking and other covariates, respiratory cancer risk was highest in BWN vs other veterans (theatre: aOR 1.65; 95% CI 1.09, 2.50; non-theatre: aOR 1.77; 1.13, 2.77) and to non-veterans (aOR 1.78; 1.15, 2.74). Other findings showed BWN’s health risks between theatre and non-theatre veterans.
Conclusion: There was a higher risk for respiratory cancers in BWN. Other risks were less than theatre veterans but greater than non-theatre or non-veterans, indicating a potential role of military exposures in BWN’s health.
Word count: 8297
Keywords: Vietnam War, Blue Water Navy, veterans, military, exposure
Conflict of interest: The authors report no conflicts of interest.
Introduction
The Blue Water Navy (BWN) of the Vietnam War served on ships on the offshore waters of former South and North Vietnam, not on inland rivers, estuaries or the land. BWN were engaged in combat, surveillance and interdiction, transport and supply, rescue and humanitarian operations. Little evidence documents their health after military service in BWN. Although BWN did not have ‘boots on the ground’ during the war like their theatre veteran counterparts who were exposed to and had effects from the stresses and physical hazards of wartime military operations, we hypothesise that exposure risks experienced by BWN were similarly hazardous.
Harmful exposures during the Vietnam War cannot be precisely quantified; the primary exposure studied here is veteran status in the Vietnam War theatre of operations. BWN report that in addition to recognised shipboard hazards (e.g., fuels, solvents, second-hand tobacco smoke, asbestos) and combat service, they came into direct contact with chemically contaminated seawater that was used for bathing and drinking after desalinisation and plumes of sprayed chemicals drifting from landbased applications. One potential exposure was to 2,3,7,8-tetrachlorodibenzo-p-dioxin (TCDD), which contaminated the tactical herbicide known as Agent Orange. TCDD has varying evidence of association with human harm, including teratogenicity, carcinogenicity, immunologic effects, possible endocrine disruption and hypothesised epigenetic effects.
The Vietnam-era soldiers and sailors who were exposed to herbicides and suffered health consequences are based on limited scientific evidence with sometimes conflicting conclusions. In a laboratory experiment, Australian Government scientists distilled water containing chemical components of Vietnam War tactical herbicides, including dioxins. This Australian Government study concluded that evaporative distillation was a potential route of exposure. However, actual exposures to BWN could not be quantified. In 2011, the National Academy of Science’s Institute of Medicine (IOM) reviewed the available evidence on the likelihood of BWN’s exposures. IOM formed an independent committee to assess ‘whether the Vietnam veterans in the Blue Water Navy experienced exposures to herbicides and their contaminants comparable with the Brown Water Navy Vietnam Veterans (who served on inland rivers and estuaries) and those on the ground in Vietnam’. The IOM committee concluded that there was possible but unquantifiable exposure by inhalation from aerial spray drift, ingestion of or dermal exposure to drifted spray and contaminated sea water, and ingestion, inhalation and dermal exposure to distilled shipboard water.
The overall health of the Vietnam War BWN has never been systematically studied. A case-control study of selected cancers among Vietnam Veterans by the CDC included a BWN-like cohort (those who served on ‘ocean-going vessels’) among those who served in four land-based regions (corps) in Vietnam (odds ratio (OR) BWN vs land-based corps 2.17 (99% CI, 1.22-3.86; p=0.11). They found the BWN veterans had the second-highest risk of non-Hodgkin’s lymphoma. I corps (troops active in northern South Vietnam) demonstrated higher odds of NHL (OR 2.25, 95% CI 1.21, 4.28; p=0.59). The OR for Hodgkin’s lymphoma was similarly elevated: highest for I corps than BWN. These regression analyses adjusted for NHL risk factors.
An exploratory aim of this study was to describe BWN’s health. We hypothesised that their health would lie between theatre veterans (who generally had the highest exposure to war conditions and, therefore, the poorest health measures) and nontheatre veterans who served entirely outside the war theatre during the Vietnam era. Age- and sex-matched civilians who had never served in the military were included. These non-veterans, we thought, would report the best health. Assuming better health in non-veterans contradicts the premise of the ‘healthy soldier effect’ where servicemembers selected for military service based on physical and mental health frequently perform better than non-veterans on measurements of these factors. However, findings from several previous studies indicate that the ‘healthy soldier effect’ may diminish and disappear over time, possibly due to the lingering effects of exposures incurred in military service. We further hypothesised that BWN veterans would report poorer health than Navy veterans who served outside the war theatre. This paper is a comparative analysis of BWN’s health by Vietnam War-era veteran status.
Materials and methods
Study design
This cross-sectional study was a mail survey of a stratified random sample of 45 067 living veterans who served in the US Military from 28 February 1961 to 7 May 1975, the Congressionally defined Vietnam War era. The sampling frame was 9.9 million records of Vietnam-era service members in the US Veterans Eligibility Trends and Statistics (USVETS). A control group of 6885 non-veterans born before 1958 was selected from a two-stage random sample of 300 000 US households and matched by age and sex with the Vietnam Veterans; Figure 1 presents the study flow. The survey for veterans was a 24-page, 91-item instrument of newly developed questions and previously validated items, including the SF826 and questions from the 2010 National Survey of Veterans. The length of the survey was dictated by the need for a comprehensive survey of physical and mental health, demographics and life course information balanced by the risk of overburdening potential respondents because of survey length. We consulted with Vietnam-era veterans on survey questions and length. The survey was qualitatively tested for comprehension and feasibility—including length—and revised accordingly. We fielded the survey from November 2016 through March 2017. The non-veteran survey was identical, except that military service questions were eliminated. The veteran and non-veteran surveys are available from the authors.
Study populations
BWN were the primary population of interest for these analyses. Definitive computerized records of where individual veterans served during the Vietnam war era are unavailable. There is no roster of BWN to our knowledge; the study intent to describe BWN was exploratory as we had little information on population size, characteristics and response likelihood. From a Congressional Research Service report and an estimate provided by the Blue Water Navy Vietnam Veterans Association we projected there were 80 000 BWN at the time of study development. Based on a goal of 12 000 veteran responses (6000 Vietnam theatre, 6000 non-theatre including BWN) we projected 200 BWN responses. BWN were considered non-theatre veterans for sample size estimation but were distinguished by a survey question: ‘Are you a Blue Water Navy Veteran? In other words, was your Vietnam service limited to the offshore waters of Vietnam?’. Other veteran status was defined from survey questions as: 1) Vietnam or ‘theatre’ veterans who served in Vietnam, Cambodia, and/or Laos; 2) non-theatre; 3) nontheatre Navy veterans. Non-theatre Navy veterans reported service outside of the war theatre and/or its offshore waters and were included to compare BWN to general Navy veterans; 4) Non-veterans were born before 1958 and never served in the US Military. Nonveterans were included to assess differences between those with military service and those without; such a comparison helps separate health effects of ageing from the long-term effects of military service.
Exposure measures
The main exposure studied was veteran status relative to service in the Vietnam theatre of operations. In addition, exposures to fuels, lead, solvents, pesticides and herbicides were collected from a question newly developed and tested for the study: ‘Have you ever been heavily exposed to any of the following … because of your military service? By heavily, we mean long-term, daily or extreme exposure.’
Demographics, health conditions and lifestyle factors
Sociodemographic data, including age, marital status and education level were collected, as were military service variables (e.g., age at entry, duration of service). Lifestyle factors including cigarette smoking patterns and pack-years, alcohol use as quantified by the AUDIT-C, body mass index (BMI) in kg/m,2 psychologic distress (Kessler-6)35 and past/current recreational drug use were collected. Post-traumatic stress disorder (PTSD), used here as a covariate that strongly influences overall health, was a composite measure of an ‘ever’ doctor or health professional diagnosis and/or three or more positive responses on the Primary Care PTSD screen for DSM-5 (PC-PTSD-5).
SF-8™ scores measured general physical and mental health. Physical and mental component summary scores were derived from eight survey questions using norm-based scoring methods, with lower scores indicating poorer health. A score of 50 reflects the average of the 1998 general US population.
Physician-diagnosed health conditions were based on questions obtained from the 2013–2014 National Health and Nutrition Examination Survey that asked, ‘Have you ever been told by a doctor or health professional that you had…?’. ‘Any cancer’ indicated a positive response to a cancer diagnosis of those asked on the survey.
The study was approved by the US Department of Veterans Affairs Central Institutional Review Board (#15-12), which allowed information enclosed with the study mailing and a returned survey in lieu of written informed consent.
Statistical analyses
Survey data were weighted to adjust for differences in selection probability and non-response to provide representative estimates of the US Vietnam-era veteran population by sex, age and period of Vietnam War service (1961–64 or 1965–75). In addition to weighting the data, we further adjusted for the complex study design by using jack-knife replications to calculate the standard errors of the estimates. We performed hot deck imputation40 for missing values of 16 key survey items that were pre-designated to define a complete survey and imputed if a survey had any missing data for a key item after data cleaning. Hot deck imputation replaces missing data with imputed values from others’ survey responses that were similar. Eliminating missing data by imputation allows for consistent analysis from one user to the next, avoids large biases in estimates of totals, can reduce nonresponse bias in other types of estimates and allows the use of multiple key items when conducting multivariate analyses when the alternative is to drop all such cases. The hot deck imputation plan is available from the authors.
Descriptive results included unweighted counts and weighted percentages of health conditions and military service-related exposures by veteran status. We conducted univariable analyses to test the existence of associations (cross-tabs, simple regression), and investigated correlations and multicollinearity among variables. We also used a 0.05 level of significance as an inclusion criterion, as well as adequate cell size. In the multivariable models, we included variables that satisfied these criteria and were considered important risk factors based on published literature and subject matter expertise.
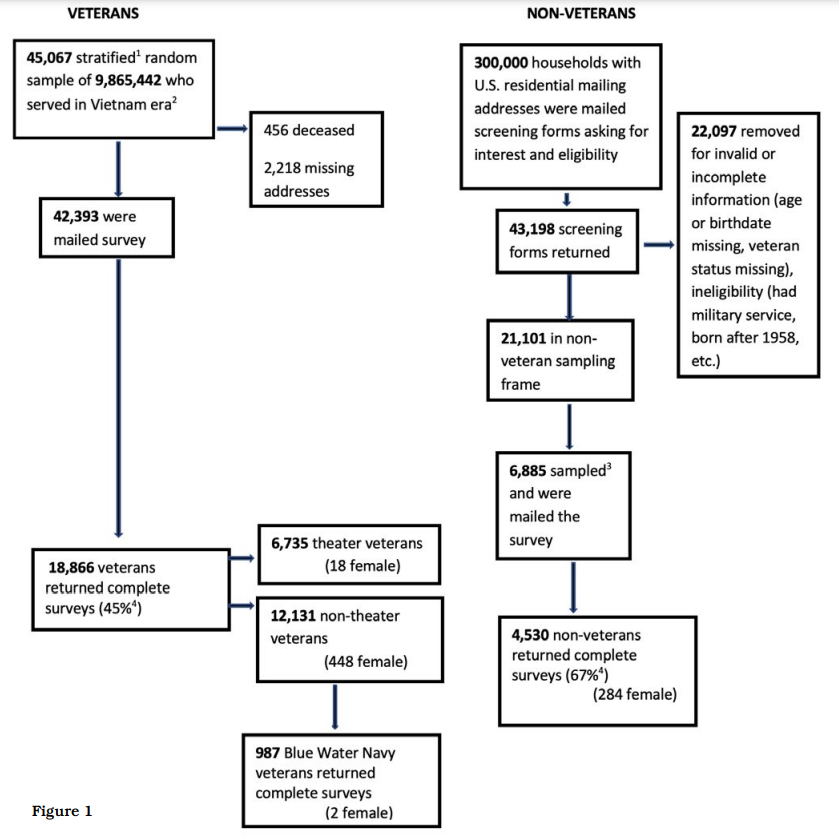
Figure 1
We used multivariable regression models to estimate adjusted odds ratios (aOR) and associated 95% confidence intervals (CI). The associations between health conditions and veteran status were estimated, controlling for demographics and health-related independent variables; results are presented from two final regression models. The first model compared BWN to theatre, non-theatre and non-veterans. The second model compared BWN to non-theatre Navy and assessed the associations of BWN service to Navy service outside the war theatre or its coastal waters. We started with the same covariates in both models: age in years at the time of the survey, BMI (≤ 25 kg/m2 or > 25 kg/m2), PTSD (yes/no), packyears of cigarette smoking (0, >0< 15, 15–30, >30) and education (high school or less, some college, undergraduate degree, graduate degree). In the first model, we also adjusted for race/ethnicity (White, African American, other race, Hispanic) and marital status (married/de facto, divorced/separated, widowed, never married). The second model did not include race/ethnicity and marital status since small cell counts for these covariates did not allow models to converge.
Age was a covariate because of its relationship with health, the heterogeneity in ages of Vietnam-era service members due to the war’s long duration and conscription of younger individuals during the peak war years (1965–70). 43 Race/ethnicity,44 BMI, cigarette smoking, marital status and education were covariates because of their association with health outcomes in veterans. PTSD was included because of its prevalence in military veterans and its association with cardiovascular disease, other health conditions, and mortality. Covariates considered and excluded based on adjusted analyses were alcohol dependence, military service branch, age at entry to the military and duration of military service because they did not satisfy the inclusion criteria. Military service-related exposures to fuels, lead, solvents, pesticides and herbicides were not included in the final model because their prevalence closely paralleled veteran status and self-reported exposures were thought to be less precise than the self-reported veteran status of having served in the war theatre or non-theatre.
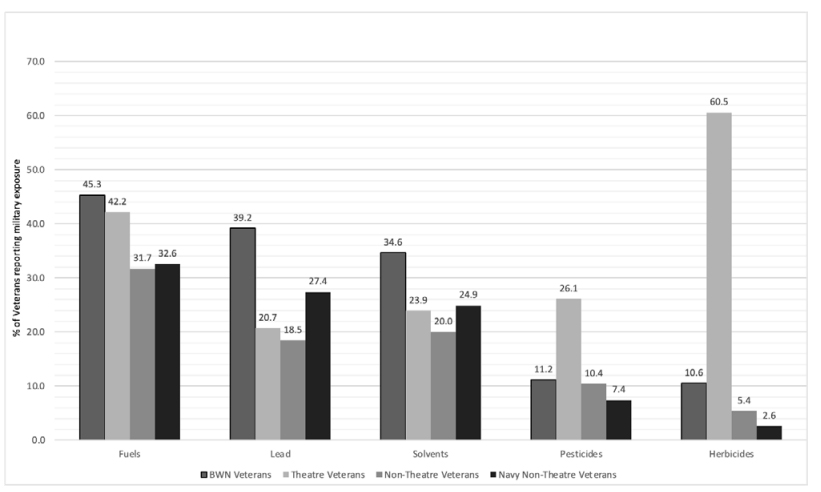
Figure 2. Selected self-reported military service-related exposures by veteran status
Table 1: Sociodemographic, health risks and military service characteristics of male respondents by veteran status
| All | Blue Water Navy (BWN) | Theatre Veterans | Non-Theatre Veterans (excludes BWN) | Non Veterans | ||
|---|---|---|---|---|---|---|
| (n=22 646) | (n=985) | (n=6717) | (n=10 698) | (n=4246) | ||
| (Unweighted counts and weighted percentages) n (%) |
||||||
| Sociodemographic and health risks | ||||||
| Age range (years) | 58-65 | 6423 (46.0) | 278 (34.8) | 448 (8.2) | 3447 (39.3) | 2250 (53.9) |
| 66–70 | 9110 (28.6) | 399 (38.5) | 3758 (58.7) | 3982 (34.5) | 971 (22.1) | |
| 71–75 | 4616 (14.6) | 212 (19.5) | 1716 (23.7) | 2141 (17.5) | 547 (12.4) | |
| 76–80 | 1701 (6.4) | 62 (4.1) | 467 (4.4) | 866 (6.3) | 306 (6.8) | |
| 80+ | 796 (4.3) | 34 (3.1) | 328 (4.9) | 262 (2.4) | 172 (4.8) | |
| Age, years mean SE | 67.3 (0.1) | 68.0 (0.2) | 70.09 (0.0) | 67.7 (0.0) | 66.72 (0.1) | |
| BMI, mean SE | 28.6 (0.1) | 29.2 (0.2) | 29.0 (0.1) | 29.0 (0.1) | 28.43 (0.1) | |
| Race/Ethnicity | White, nonHispanic | 18993 (84.9) | 857 (87.5) | 5621 (83.8) | 8887 (82.7) | 3628 (85.7) |
| African American | 1634 (6.4) | 51 (5.7) | 485 (7.1) | 875 (8.6) | 223 (5.6) | |
| Other race, non-Hispanic | 844 (4.7) | 34 (3.9) | 246 (3.9) | 360 (3.6) | 204 (5.1) | |
| Hispanic | 942 (4.0) | 28 (2.9) | 294 (5.2) | 4476 (5.1) | 144 (3.5) | |
| Education | High school or less | 5800 (24.5) | 266 (28.11) | 1782 (27.47) | 2778 (26.81) | 974 (23.4) |
| Associate degree or some college | 8906 (32.4) | 448 (46.8) | 2828 (43.8) | 4475 (43.6) | 1155 (27.3) | |
| Bachelor’s degree | 4080 (22.2) | 144 (14.5) | 1081 (16.2) | 1806 (16.9) | 1049 (24.8) | |
| Master, Professional, PhD | 3466 (20.8) | 112 (10.6) | 884 (12.6) | 1436 (12.7) | 1034 (24.5) | |
| Marital status | Married/De facto | 17430 (77.8) | 773 (79.7) | 5255 (79.2) | 8113 (76.4) | 3289 (78.0) |
| Divorced/Separated | 2830 (12.9) | 97 (10.7) | 779 (12.2) | 1474 (14.6) | 480 (11.9) | |
| Widowed | 1200 (4.5) | 60 (6.2) | 410 (5.9) | 570 (5.3) | 160 (4.0) | |
| Never married | 844 (5.3) | 31 (3.5) | 170 (2.7) | 395 (3.8) | 248 (6.2) | |
| Cigarette smoking | Non-smoker | 7699 (43.4) | 294 (30.0) | 1900 (28.5) | 3431 (32.1) | 2074 (39.1) |
| Current smoker | 3278 (12.8) | 147 (16.3) | 981 (15.4) | 1693 (17.2) | 457 (11.1) | |
| Former smoker | 11314 (43.8) | 522 (53.8) | 3693 (56.1) | 5416 (50.7) | 1683 (39.8) | |
| Cigarette pack-years | 0 | 7699 (46.3) | 294 (31.9) | 1900 (31.4) | 3431 (35.0) | 2074 (51.8) |
| >0 <15 | 4482 (21.0) | 190 (21.1) | 1346 (22.7) | 2136 (22.1) | 810 (20.4) | |
| >15 <= 30 | 2973 (12.3) | 147 (16.5) | 903 (15.4) | 1486 (15.3) | 437 (10.9) | |
| >30 <= 45 | 2145 (8.4) | 101 (11.2) | 696 (11.7) | 1064 (11.3) | 284 (7.1) | |
| >=45 <60 | 1681 (6.2) | 85 (9.6) | 606 (10.1) | 795 (8.4) | 195 (4.9) | |
| >= 60 | 1565 (5.9) | 84 (9.7) | 524 (8.7) | 764 (8.0) | 193 (4.9) | |
| Military service characteristics | ||||||
| Military Branch | Army | 8700 (47.3) | 21 (2.3) | 3662 (54.4) | 5017 (47.4) | |
| Navy | 3970 (21.6) | 924 (94.2) | 1193 (18.0) | 1853 (17.1) | ||
| Air Force | 3861 (20.7) | 9 (0.7) | 994 (14.3) | 2858 (26.1) | ||
| Marine Corps | 1614 (9.4) | 25 (2.7) | 826 (13.0) | 763 (7.9) | ||
| Coast Guard | 183 (1.0) | 1 (0.1) | 18 (0.3) | 164 (1.5) | ||
| Age at entry to Military (years) | <= 20 | 12246 (71.6) | 757 (81.0) | 4565 (70.5) | 6924 (71.3) | |
| 21–25 | 5234 (27.0) | 189 (17.8) | 2000 (28.7) ) | 3045 (30.0 | ||
| >= 26 | 297 (1.4) | 13 (1.16) | 74 (0.86) | 210 (1.7) | ||
| Length of Military Duty (years) | <5 | 12551 (71.8) | 587 (63.1) | 4446 (69.7) | 7518 (73.9) | |
| ≥5 <10 | 1798 (10.3) | 135 (14.0) | 589 (8.9) | 1074 (10.8) | ||
| ≥10 <20 | 651 (3.6) | 44 (4.4) | 260 (3.5) | 347 (3.5) | ||
| >20 | 2808 (14.3) | 193 (18.5) | 1356 (18.0) | 1259 (11.8) | ||
a) Blue Water Navy (BWN) served in waters offshore North or South Vietnam during the 1961–1975 Vietnam War; non-theatre Navy served in the 1961–1975 Vietnam era but not in BWN or the Vietnam War theatre. Males only.
b) Chi square tests of proportions were significant for all sociodemographic, health risks and military variables across the veteran status groups.
c) weighted mean
Physician-diagnosed health conditions of 10 or fewer responses are not reported due to privacy concerns. Statistical significance was defined as p ≤ 0.05, two-tailed. Analyses employed SAS procedures for complex survey designs (SAS Enterprise Guide Version 7.15; Cary, North Carolina).
Results
There were 6735 Vietnam theatre, 12 131 nontheatre veteran respondents (including BWN) and 4530 non-veteran respondents (overall veteran response, 45%; non-veteran response, 67%, using the American Association of Public Opinion Research response rate 4.0 calculator. 56 (Figure 1). Contrary to our projected 200 BWN respondents, there were 987 (985 men, 2 women) who attested to serving only on Blue Water ships in the Vietnam War (Figure 1). These analyses included only males because of the few BWN female respondents.
Table 1 shows the characteristics of the male respondents (unweighted counts and weighted percentages). BWN respondents averaged two years younger than their Vietnam theatre counterparts at the time of the survey (68.0 vs 70.1 years, respectively). They were similar in age to non-theatre veterans (67.7 years). Respondents were predominantly white, with BWN comprising the highest percentage at 87.5%, Vietnam theatre 83.8%, non-theatre veterans 82.7% and non-veterans 85.7%. BWN had the highest proportion entering military service at 20 years old or younger (81%) and the highest proportion with greater than 20 years of military service (18.5%).
BWN were frequent current smokers (16.3%) and had the highest percentage of 60 or more packyear smokers (9.7%). A higher percentage of BWN reported fuel (45.3% BWN vs 42.2% theatre or 31.7% non-theatre), lead (39.2% BWN vs 20.7% theatre or 18.5% non-theatre), and/or solvent exposures (34.6% BWN vs 24.3% theatre or 21.1% non-theatre) than the other veterans. In comparison, theatre veterans reported a higher percentage of exposure to herbicides (60.5% theatre vs 10.6% BWN vs 5.4% non-theatre), as well as higher exposures to pesticides (26.1% theatre vs 11.2% BWN vs 10.4% non-theatre. Figure 2).
Measuring overall physical health, 62.6% of BWN reported an SF-8™ physical component summary score <50 (indicating poor health) compared to 74.6% of theatre veterans (aOR 0.77, 95% CI 0.65, 0.91. Tables 2 and 3).
| All | Blue Water Navy Veterans (BWN) |
Theatre Veterans | Non-theatre Veterans (excludes BWN) | Non-Veterans | |
|---|---|---|---|---|---|
| Health conditions, n (%) | (n=22 646) | (n=985) | (n=6717) | (n=10 698) | (n=4246) |
| Poor physical health past 4 weeks, SF-8, score <50 | 13796(53.14) | 591(62.61) | 4788(74.61) | 6459(63.54) | 1958(46.93) |
| Hypertension | 14868(60.77) | 666(67.54) | 4750(70.95) | 6999(65.35) | 2453(57.79) |
| Ischaemic heart disease | 4328(15.38) | 182(18.13) | 1648(24.41) | 1926(17.54) | 572(13.33) |
| Stroke | 1620(5.99) | 77(8.11) | 565(8.41) | 757(6.92) | 221(5.31) |
| Diabetes Mellitus Type 2 | 5592(19.99) | 241(23.83) | 1977(29.43) | 2641(24.63) | 733(17.18) |
| Hypothyroidism | 2116(8.56) | 90(8.87) | 752(11.1) | 929(8.71) | 345(8.13) |
| Autoimmune disease | 766(3.46) | 38(3.76) | 242(3.58) | 336(3.19) | 150(3.52) |
| Chronic obstructive pulmonary disease | 2975(9.71) | 152(14.92) | 1173(17.45) | 1330(12.66) | 320(7.58) |
| Obstructive sleep apnoea | 5504(19.85) | 243(24.53) | 2073(31.33) | 2455(23.06) | 733(17.1) |
| Peripheral Neuropathy | 2828(9.85) | 109(10.92) | 1244(18.53) | 1116(10.36) | 359(8.36) |
| Parkinson’s disease | 322(1.15) | 14(1.44) | 143(2.13) | 123(1.11) | 42(1.0) |
| Dementia/Alzheimer’s | 495(1.7) | 25(2.29) | 230(3.28) | 181(1.61) | 59(1.47) |
| Brain injury/Concussion | 2612(12.06) | 111(11.74) | 866(13.1) | 1116(10.92) | 519(12.23) |
| Cirrhosis | 453(1.57) | 19(1.98) | 175(2.78) | 206(2.08) | 53(1.23) |
| Any cancer | 4214(15.5) | 174(17.25) | 1557(22.68) | 1881(16.88) | 602(13.98) |
| Brain cancer | 143(0.38) | ≤10 | 60(0.91) | 71(0.65) | 10(0.23) |
| Colon cancer | 486(1.59) | 16(1.63) | 186(2.67) | 228(2.07) | 56(1.30) |
| Hodgkin’s lymphoma | 85(0.37) | ≤10 | 32(0.48) | 33(0.31) | 16(0.37) |
| Non-Hodgkin’s lymphoma | 263(0.83) | ≤10 | 105(1.60) | 123(1.1) | 28(0.63) |
| Liver Cancer | 111(0.34) | ≤10 | 40(0.61) | 56(0.54) | 10(0.23) |
| Pancreatic cancer | 85(0.32) | ≤10 | 36(0.53) | 33(0.32) | 12(0.29) |
| Prostate cancer | 2149(8.22) | 88(8.51) | 768(11.01) | 960(8.36) | 333(7.75) |
| Respiratory cancers | 536(1.81) | 33(3.38) | 210(3.19) | 229(2.13) | 64(1.48) |
| Soft tissue sarcoma | 736(2.58) | 26(2.64) | 339(4.90) | 274(2.48) | 97(2.25) |
| Testicular cancer | 100(0.44) | ≤10 | 36(0.52) | 40(0.40) | 20(0.44) |
| Thyroid cancer | 146(0.44) | ≤10 | 56(0.87) | 5(0.28) | 15(0.35) |
| Urinary bladder cancer | 434(1.51) | 25(2.54) | 156(2.26) | 197(1.82) | 56(1.28) |
| Poor mental health past 4 weeks, SF-8, score <50 | 8077(30.07) | 311(34.78) | 3115(49.24) | 3601(36.23) | 1050(25.46) |
| PTSD past or current | 4129(10.55) | 124(13.79) | 2488(39.6) | 1305(13.76) | 212(5.2) |
| Depression | 5626(19.95) | 202(21.62) | 2378(36.4) | 2347(22.94) | 699(16.57) |
| High psychological distress past 30 days (K-6 score >10) | 2202(6.63) | 80(8.91) | 1015(15.97) | 924(9.38) | 183(4.39) |
| Alcohol dependence ever | 2340(7.1) | 106(11.3) | 1016(15.73) | 1017(10.24) | 201(4.81) |
| Drug dependence ever | 950(3.1) | 46(5.29) | 365(5.87) | 453(4.83) | 86(2.15) |
a) Weighted for non-response and probability of selection.
b) Veteran status: Blue Water Navy (BWN)=aboard ship on offshore waters of Vietnam; Vietnam theatre=Vietnam, Cambodia, Laos; non-theatre veterans=military service in other locations; nonveteran=never served in military and born before 1958.
c) of the cancers on the survey (brain, colon, Hodgkin’s lymphoma, non-Hodgkin’s lymphoma, liver, pancreatic, prostate, respiratory, soft tissue sarcoma, testicular, thyroid, urinary bladder).
Table 3. Adjusted odds ratios of health conditions of BWN vs other veteran status groups
| Characteristic/Condition | Veteran Status Comparisons | ||
|---|---|---|---|
| Blue Water Navy (BWN) to Theatre Veterans |
BWN to Non-Theatre Veterans (excludes BWN) |
BWN to Non-Veterans |
|
| Poor physical health past 4 weeks, SF-8, score <50 |
0.77(0.65,0.91) | 0.92(0.80,1.07) | 1.25(1.06,1.46) |
| Hypertension/High blood pressure | 0.96(0.79,1.17) | 1.03(0.87,1.22) | 1.19(0.99,1.43) |
| schaemic heart disease | 0.91(0.74,1.11) | 0.97(0.80,1.17) | 1.02(0.83,1.26) |
| Stroke | 1.53(1.11,2.10) | 1.24(0.92,1.68) | 1.33(0.95,1.84 |
| Diabetes mellitus | 0.89(0.73,1.08) | 0.93(0.77,1.12) | 1.20(0.97,1.48) |
| Hypothyroidism | 1.16(0.92,1.47) | 1.15(0.89,1.48) | 1.19(0.89,1.59) |
| Autoimmune disorder | 1.42(0.92,2.20) | 1.28(0.88,1.84) | 1.18(0.78,1.78) |
| Chronic obstructive pulmonary disease (COPD) |
1.12(0.88,1.42) | 1.18(0.93,1.48) | 1.33(1.03,1.71) |
| Obstructive sleep apnoea (OSA) | 0.90(0.71,1.13) | 1.03(0.84,1.26) | 1.23(1.00,1.52) |
| Peripheral neuropathy | 0.76(0.60,0.95) | 1.03(0.82,1.31) | 1.02(0.79,1.31) |
| Parkinson’s | 1.48(0.78,2.80) | 1.53(0.81,2.92) | 1.69(0.84,3.43) |
| Dementia/Alzheimer | 1.35(0.80,2.29) | 1.49(0.89,2.50) | 1.36(0.82,2.26) |
| Brain Injury/Concussion | 1.30(0.99,1.69) | 1.09(0.85,1.41) | 0.80(0.61,1.05) |
| Cirrhosis | 1.20(0.75,1.92) | 1.15(0.67,1.96) | 1.34(0.76,2.36) |
| Depression | 0.89(0.71,1.11) | 0.98(0.79,1.20) | 1.06(0.85,1.31) |
| Alcohol dependence | 1.01(0.75,1.37) | 1.24(0.93,1.65) | 1.91(1.38,2.64) |
| Drug dependence | 1.58(1.00,2.51) | 1.24(0.80,1.92) | 1.71(1.04,2.81) |
| Hepatitis C | 1.27(0.88,1.83) | 1.11(0.78,1.58) | 1.38(0.95,2.01) |
| Brain cancerc | |||
| Colon cancer | 0.73(0.35,1.50) | 0.73(0.36,1.48) | 1.01(0.48,2.15) |
| Hodgkin’s lymphomac | |||
| Non-Hodgkin’s lymphoma c | |||
| Liver cancerc | |||
| Prostate cancer | 0.93(0.70,1.23) | 1.06(0.80,1.39) | 1.15(0.86,1.53 |
| Respiratory cancers | 1.65(1.09,2.50) | 1.77(1.13,2.77) | 1.78(1.15,2.74 |
| Soft tissue sarcoma | 0.55(0.36,0.85) | 0.90(0.56,1.43) | 1.00(0.64,1.56) |
| Testicular cancerc | |||
| Thyroid cancercc | |||
| Urinary bladder | 1.55(0.83,2.87) | 1.27(0.70,2.32) | 1.66(0.87,3.16 |
| Any cancer | 0.88(0.72,1.07) | 1.01(0.83,1.22) | 1.18(0.96,1.45) |
In bold: statistically significant; 95% CI do not cross 1.0
a) The associations between BWN, Vietnam theatre, non-theatre veteran or non-veteran and health outcomes were adjusted for age, Body mass index (BMI), Post-traumatic stress disorder (PTSD), education, cigarette pack-years, race/ethnicity and marital status
b) Veteran status: Blue Water Navy (BWN)=aboard ship on offshore waters of Vietnam; Vietnam theatre=Vietnam, Cambodia, Laos; non-theatre veterans=military service in other locations; nonveteran=never served in military and born before 1958.
c) Count not reported and outcome not modelled, cell size ≤10 d of the cancers on the survey (brain, colon, Hodgkin’s lymphoma, non-Hodgkin’s lymphoma, liver, pancreatic, prostate, respiratory, soft tissue sarcoma, testicular, thyroid, urinary bladder).
Table 4. Blue Water Navy compared to non-theatre Navya—Sociodemographic, exposures and health conditions, males
| Blue Water Navy (BWN) (n=985) n (%) |
Non-Theatre Navy (n=1853) n (%) |
||
|---|---|---|---|
| (Unweighted counts, weighted percentages) | |||
| Sociodemographic and health risks | |||
| Age range (years) | |||
| 58–65 | 278(34.77) | 572(38.57) | |
| 66–70 | 399(38.47) | 722(36.1) | |
| 71–75 | 212(19.54) | 381(18.12) | |
| 76–80 | 62(4.13) | 144(5.66) | |
| 80+ | 34(3.09) | 34(1.55) | |
| Overweight or obese BMI (> 25/m2) | 756(81.06 | 1413(78.61) | |
| Race/Ethnicity | |||
| White, non-Hispanic | 857(87.53 | 1661(89.76) | |
| African American | 51(5.69 | 66(4.01) | |
| Other race, non-Hispanic | 34(3.9) | 56(3.15) | |
| Hispanic | 28(2.87) | 51(3.09) | |
| Education | |||
| High school or less | 266(28.11 | 456(25.84) | |
| Associate degree or some colleg | 448(46.75) | 803(44.71) | |
| achelor’s degree | 144(14.51) | 297(16.07) | |
| Master, Professional, PhD | 112(10.64) | 263(13.38) | |
| Marital Status | |||
| Married/De facto | 773(79.65) | 1426(77.23 | |
| Divorced/Separated | 97(10.67) | 240(13.76) | |
| Widowed | 60(6.16) | 96(5.05) | |
| Never married | 31(3.52) | 68(3.96 | |
| Cigarette smoking | |||
| Non-smoke | 294(29.97) | 574(30.78) | |
| Current smoker | 147(16.27) | 280(16.74) | |
| Former smoker | 522(53.76) | 978(52.48) | |
| Cigarette pack-years | |||
| 0 | 294(31.86) | 574(33.63) | |
| >0 <15 | 190(21.09) | 377(22.37) | |
| >15 <= | 30 147(16.5) | 257(15.63) | |
| >30 <= 45 | 101(11.23) | 206(12.61) | |
| >=45 <60 | 85(9.57) | 145(8.76) | |
| >= 60 | 84(9.74) | 117(7.01) | |
| PTSD, past or current | 124(13.79) | 187(11.31) | |
| Military Service | |||
| Branch | |||
| Army | 21(2.33) | 0 | |
| Navy | 924(94.2) | 1853 (100.0) | |
| Air Force | <10 | 0 | |
| Marine Corps | 25(2.67) | 0 | |
| Coast Guard | <10 | 0 | |
| Age at Entry to Military, years n (%) | |||
| <= 20 | 757(81) | 1341(78.01) | |
| 21–25 | 189(17.84) | 405(20.42) | |
| >= 26 | 13(1.16) | 37(1.57) | |
| Exposures | |||
| Herbicides | 105(10.56) | 48(2.62) | |
| Fuel | 425(45.31) | 576(32.59) | |
| Solvents | 327(34.62) | 432(24.92) | |
| Lead | 371(39.2) | 485(27.39 | |
| Pesticides | 105(11.17) | 132(7.41) | |
| Health conditions | Adjusted odds ratio2 (95%CI) |
||
| Poor physical health past 4 weeks, SF-8, score <50 |
591(62.61) | 1064(59.86) | 1.07 (0.90,1.28) |
| Hypertension | 666(67.54) | 1165(62.25) | 1.11 (0.93,1.33) |
| Ischaemic Heart Disease | 182(18.13) | 318(16.24) | 1.05 (0.85,1.31) |
| Stroke | 77(8.11) | 118(6.13) | 1.24 (0.90, 1.71) |
| Diabetes mellitus type | 2 241(23.83) | 432(22.64) | 1.02 (0.82, 1.27) |
| Hypothyroidis | 90(8.87) | 167(9.16) | 1.00 (0.74, 1.35) |
| Autoimmune disorder | 38(3.76)v | 74(3.9) | 1.00 (0.63, 1.59) |
| Chronic obstructive pulmonary disease (COPD) |
152(14.92) | 227(12.45) | 1.24 (0.94, 1.630) |
| OSA (obstructive sleep apnoea) | 243(24.53) | 442(23.8) | 0.98 (0.78, 1.23) |
| Peripheral neuropathy | 109(10.92) | 190(10.04) | 1.11 (0.85,1.45) |
| Parkinson’s disease | 14(1.44) | 26(1.43) | 1.02 (0.46, 2.25) |
| Dementia/Alzheimer’s disease | 25(2.29) | 34(1.87) | 1.16 (0.60,2.24) |
| Brain Injury/Concussion | 111(11.74) | 168(9.47) | 1.29 (0.94,1.76) |
| Cirrhosis | 19(1.98) | 25(1.55) | 1.58 (0.76,3.28) |
| Depression | 202(21.62) | 385(21.6) | 0.98 (0.78, 1.23) |
| Alcohol dependence | 106(11.3) | 170(9.8) | 1.22 (0.90, 1.66) |
| Drug dependence | 46(5.29) | 74(4.65) | 1.04 (0.62, 1.74) |
| Hepatitis C | 66(7.28) | 96(5.71) | 1.33 (0.88, 2.00) |
| HIVb | ≤ 10 | ≤10 | |
| Brain cancerb | ≤ 10 | 14(0.77) | |
| Colon cancer | 16(1.63) | 43(2.21) | 0.58 (0.29, 1.15) |
| Hodgkin’s lymphomab | ≤ 10 | ≤ 10 | |
| Non-Hodgkin’s lymphomab | ≤ 10 | 26(1.26) | |
| Liver cancerb | ≤ 10 | ≤ 10 | |
| Pancreatic cancerb | ≤ 10 | ≤ 10 | |
| Prostate cancer | 88(8.51) | 167(8.23) | 1.04 (0.77, 1.39) |
| Respiratory cancer | 33(3.38) | 33(1.85) | 1.99 (1.11, 3.56) |
| Soft tissue sarcoma | 26(2.64) | 40(2.01) | 1.19 (0.63, 2.22) |
| Testicular cancerc | ≤ 10 | ≤ 10 | |
| Thyroid cancerc | ≤ 10 | ≤ 10 | |
| Urinary bladder cancer | 25(2.54) | 26(1.42) | 1.58 (0.81, 3.09) |
| Any cancerc | 174(17.25) | 312(15.92) | 1.06 (0.86, 1.32) |
In bold: statistically significant; 95% CI do not cross 1.0
a) Blue Water Navy (BWN) served in waters offshore North or South Vietnam during the 1961–1975 Vietnam War; non-theatre Navy served in the 1961–1975 Vietnam era but not in BWN or in the Vietnam War theatre. Males only.
b) Not modelled, cell size ≤10
c) of the cancers on the survey (brain, colon, Hodgkin’s lymphoma, non-Hodgkin’s lymphoma, liver, pancreatic, prostate, respiratory, soft tissue sarcoma, testicular, thyroid, urinary bladder).
Table 2 reports counts and weighted percentages for health conditions by veteran status. The proportion of BWN reporting health conditions was between that of theatre and non-theatre veterans for most conditions. These were hypertension, ischaemic heart disease, stroke, hypothyroidism, chronic obstructive pulmonary disease (COPD), obstructive sleep apnoea, peripheral neuropathy, Parkinson’s disease, dementia/Alzheimer’s, brain injury/concussion, any cancer, prostate cancer, soft tissue sarcoma, testicular cancer, PTSD and alcohol or drug dependence. A lower proportion of BWN reported colon cancer, diabetes mellitus type 2, cirrhosis, SF-8™ mental component summary score <50, depression or high psychologic distress than theatre or non-theatre veterans. The proportion of respondents reporting autoimmune disease and respiratory and urinary bladder cancers was highest in BWN. Table 3 shows the adjusted odds of health outcomes for BWN relative to the other veteran status groups. With adjustment for cigarette smoking and other variables, the odds of respiratory cancers among BWN were significantly greater than each of the other veteran status groups (BWN vs theatre aOR 1.65, 95% CI 1.09, 2.50; BWN vs non-theatre aOR 1.77, 95% CI 1.13, 2.77; BWN vs non-veterans 1.78 95% CI 1.15, 2.74). These results were consistent for the model comparing BWN with non-theatre Navy (aOR 1.99, 95% CI 1.11, 3.56. Table 4). Odds for stroke among BWN were also statistically greater than for theatre veterans (aOR 1.53, 95% CI 1.11, 2.10). In addition, BWN had greater odds of COPD (aOR 1.33 95% CI 1.03, 1.71) and alcohol and drug dependence than non-veterans (alcohol aOR 1.91, 95% CI 1.38, 2.64; drug aOR 1.71, 95% CI 1.04, 2.81) but were not significantly different from theatre or non-theatre veterans on this outcome (Table 3).
Discussion
Supporting our hypothesis, the weighted, unadjusted results demonstrate that the proportion of BWN reporting physician or healthcare provider diagnosed conditions was between that of Vietnam theatre and non-theatre veterans and were almost always greater than in non-veterans. Additionally, after adjustment for demographics, cigarette smoking, BMI and PTSD, a few conditions remained statistically significantly more common in BWN than one or more of the comparison groups. These were stroke, COPD, respiratory cancers, and alcohol and drug dependence.
This is the first report on the overall health of the BWN veterans of the Vietnam War, to our knowledge. Except for the 1990 CDC study of selected cancers, other Vietnam War veterans’ health studies do not evaluate the BWN as a specific population.
We compared health conditions with prior evidence of an association with exposure to the Vietnam War theatre or those conceptually associated with Vietnam War exposure, between the BWN, Vietnam theatre veterans, non-theatre veterans, non-theatre Navy veterans and age- and sex-matched nonveterans. Past studies report poorer health in Vietnam theatre veterans as measured by symptom reports, objective measures (diagnoses of hypertension, heart disease, diabetes mellitus, thyroid abnormalities, cancers including prostate and melanoma, chronic respiratory conditions), healthcare utilisation, laboratory studies (hearing loss, hepatitis B infection, sperm abnormalities), behavioural risks (smoking, alcohol and drug use) and early excess mortality compared to non-theatre veterans and/ or the general public. Others have found mixed differences in mortality outcomes.
Although the main exposure studied here was veteran status, the frequencies of environmental and other exposures reported by BWN and Vietnam theatre veterans differed. BWN reported high fuels, solvents and lead exposures. Recognised Navy shipboard exposures include contact with fuels, machinery, paints, passive tobacco smoke, asbestos and cleaning products, while Vietnam theatre veterans reported heavy herbicide and pesticide exposures. Common wartime and post-war health risks and behaviours, including elevated BMI, smoking, alcohol and drug use may potentiate effects of wartime exposures that occurred in both BWN and Vietnam theatre veterans. Differences in or combinations of exposures that could not be measured in this study may relate to health outcomes of BWN, including their statistically significantly higher risk of respiratory cancers compared to other veterans and non-veterans after adjustment for risk factors, including smoking, for which they reported the highest levels of pack-years.
A comparison of BWN to non-theatre Navy was done to assess whether outcomes seen in BWN might be associated with Navy service rather than Vietnam War service. The comparison revealed that a higher proportion of BWN reported recognised health risks: BMI in the overweight/obese range at the time of the survey, less formal education, entry into the military at 20 years or younger, more pack-years of smoking and significantly higher reported exposures to military service-related exposures queried in the survey. After adjustment, the only statistically significant health difference was the higher odds of respiratory cancers, suggesting the possibility of an association with combined exposures unique to the Vietnam War and the BWN’s shipboard exposures off coastal Vietnam.
Study strengths include the response rate—BWN responses were nearly five times the 200 estimated and the 18 866 total responding veterans exceeded our goal of 12 000. The study was designed and implemented with advice from BWN, Vietnam theatre and non-theatre veterans; this may have contributed to the response rates. Other strengths were the stratified random sample from a frame of all Vietnamera veterans and the non-veteran comparison group sampled from 300 000 randomly selected US households. We considered and adjusted for a range of potential confounders that are associated with long-term health outcomes, including smoking history, diagnosis of PTSD and elevated BMI.
Weaknesses include limited statistical power to detect a difference, especially for rare conditions including many cancers. A sample size of 6000 Vietnam theatre veterans, 6000 non-theatre veterans (which included BWN) and 4500 non-veterans was calculated to detect, with 80% power, a 20% difference between groups for diseases with a prevalence of 9%, and a 50% difference for those with a prevalence of 2% at a 2-sided level of significance of 0.05. Although this self-reported survey was an efficient way to study large numbers of a pre-defined population, responses here lack independent validation. However, agreement between self-reported conditions and medical records or physical examination is high in older adults and veteran populations. 86-87 Self-report is a well-regarded means to determine population characteristics. 88 There is potential for several types of bias: recall bias for events that happened 40–50 years ago and social desirability bias where respondents report what they believe are socially acceptable or responsible responses. Selection bias could have been introduced by the proportionately large number of BWN respondents. While we solicited advice from reliable sources on the size of the BWN population, lacking a complete roster, we cannot evaluate the response rate by BWN to the study invitation. BWN may have been motivated to participate because they sought inclusion on par with Vietnam theatre veterans for VA benefits related to their military service at the time of the study (VA benefits have since been granted89). Systematic error or information bias could have been introduced by Vietnam theatre veteran respondents, who may be more aware of and vigilant about their health than the other groups because of long-time and wellpublicised concerns regarding hazardous Vietnam War exposures.
Finally, as many as one-third of Vietnam-era veterans are deceased. Differential post-Vietnam War-related mortality may be related to outcomes reported here. For example, we did not ask about a history of mesothelioma or exposure to asbestos in our survey, an exposure common on Navy ships into the Vietnam War era that might be related to the prevalence of respiratory cancers seen here. Some participants might have reported a current diagnosis of pleural mesothelioma as ‘respiratory cancer’. However, since all forms of mesothelioma cause death rapidly, this cancer is probably best explored in mortality studies. This study team has a Vietnam-era veteran mortality study under way to assess further the association of causes of death with veteran status.
We assessed current differences in the health of BWN veterans who served in the Vietnam War, comparing BWN to theatre, non-theatre and sex and age-matched non-veterans, controlling for variables that affect risks of health outcomes. The key findings were that for most health conditions examined here, including those with a conceptual or documented association with wartime Vietnam service, there was a clear gradient that showed theatre veterans report the poorest health and highest prevalence of physician-diagnosed conditions, followed by BWN, then non-theatre veterans, with non-veterans reporting the best health, indicating that BWN may have exposures and outcomes associated with their Vietnam wartime experience. Second, BWN reported military service-related exposures that are unique to them. Last, in comparing BWN to the other veteran groups, including Navy veterans of the era who did not serve in theatre or on the coastal waters of Vietnam, we found that respiratory cancers remained significantly higher in BWN after adjustment for covariates. Given the results here, better enumeration of the Vietnam War BWN and monitoring of their health is warranted. Recent and future veterans will benefit from new efforts to document, measure and communicate hazardous military exposures. These efforts include a computerised longitudinal military exposure record that should provide information for healthcare, research and benefits90 and a common electronic medical record for military servicemembers and veterans.