
Introduction
The healthy soldier effect (HSE) explains the health benefits of military service, physical fitness and lower rates of chronic disease and mortality during and after military service.1-3 Yet recent studies have shown that veterans have poorer health outcomes and a higher risk for mortality than civilians.2,4 The altered health trajectory of US veterans has prompted research examining the possibility of ‘erosion’ of the HSE.2 Veterans often have unique health issues related to their military service. They are more likely to struggle with severe combat-related injuries, post- traumatic stress disorder (PTSD) and unhealthy behaviours, such as unfavourable weight status, tobacco use and heavy alcohol consumption.4-6
Chronic inflammatory processes are a potential mechanism linking these military stressors, such as combat injury, to the increased risk of chronic diseases.5.7 Diabetes, hypertension and hyperlipidaemia are the most prevalent ‘triad’ of chronic diseases among Veterans Affairs (VA) non- elderly (<65 years of age) and elderly (>65 years of age) individuals.8,9 The prevalence of diabetes among veterans of the VA healthcare system is three times greater than the general US population.10 Cardiovascular disease (CVD) is the leading cause of mortality among military veterans, and the incidence of cardiovascular risk factors was higher in veterans than non-veterans.3,6,11,12
Although health disparities exist in the veteran population, the dietary lifestyle recommendations for chronic disease treatment are similar for anyone with a chronic condition. A healthy dietary intake can potentially interrupt the inflammatory pathways resulting from military-specific and noncombat stressors (e.g., unhealthy weight status and poor diet) among the military population.4-7
Nutrition interventions are most effective in longevity and a healthy lifespan for individuals.13 Dietary patterns consisting of a high intake of vegetables, fruits, whole grains and nuts have anti-inflammatory properties and can prevent chronic disease.13 Anti- inflammatory foods have also been shown to reduce biomarkers of inflammation.14 On the contrary, excess macronutrient consumption influences systemic inflammation.15 Also, the macronutrient ratio and food source impact the inflammatory potential and risk of chronic disease and mortality.13 For example, in the Prospective Urban Rural Epidemiology study, total fat consumption was inversely associated with a risk of total mortality, whereas high carbohydrate intake (at least 60% of total energy) had a greater risk of total mortality.16 The extent to which energy intake impacts mortality risk remains unclear.17 Limited research has evaluated the association between macronutrient consumption and the risk of all-cause mortality in a large, nationally representative sample. Few studies have investigated their role in premature mortality among the US veteran population.
The goal of this research was to test the hypotheses that: 1) prior military service is associated with a greater age-adjusted risk of all-cause mortality; 2) the military and all-cause mortality association would be attenuated by the inclusion of additional demographic, socioeconomic and health behaviour variables; 3) dietary intake outside the nutrition recommendations is associated with an increased risk of all-cause mortality; 4) elevations in measures of the inflammation (C-reactive protein [CRP]), metabolic (HbA1c) and cardiovascular (hypertension) pathways are associated with an increased risk of all-cause mortality; and 5) the measures of CRP, HbA1c and hypertension in nested multivariable models would attenuate the dietary intake-mortality association.
Methods
Study design
The National Health and Nutrition Examination Survey (NHANES) is a research program managed by the National Center for Health Statistics (NCHS). Since 1999, the NHANES has been executed continuously in 2-year waves, which are released to the public as serial, cross-sectional datasets. The NHANES uses a complex, multistage probability sample design.18 Among the strengths of the NHANES dataset is that it is a large nationally representative sample that surveys over 5000 individuals each year.19 The survey modules include dietary, demographic, socioeconomic and health-related questions.19 The examination and biological components contain medical, dental and physiological measurements and laboratory tests based on blood and urine samples.19 Data from the findings aid in determining the prevalence of disease and related risk factors, assessment of nutritional status and developing public health policy for Americans.19
The NCHS Institutional Review Board approved the study protocols of the NHANES. Written consent was obtained from all participants. Additionally, the University of Texas at San Antonio Institutional Review Board determined the study to be research not involving human subjects as defined in 45 CFR 46.104(3)(A).
Participants
The interviews and examinations were administered to non-institutionalised US civilians. In addition, Mexican Americans, non-Hispanic Blacks, non- Black Asians, low-income whites and other persons (at or below 185% of the federal poverty level), children 0–11 years and adults 80 and older were oversampled to increase the reliability and accuracy for these specific subgroups.18,20 Participants aged 18 years and older who had complete data for the demographic, socioeconomic, health behaviours, dietary factors and biomarkers of inflammation in the first four continuous waves, collected from 1999– 2008 with mortality follow-up through December 2015, were included in the analysis. The mortality follow-up through December 2015 is the most recent mortality data available for the NHANES study.
Measures
The outcome measure for this study was all-cause mortality from the National Death Index. Follow-up time was measured as the number of months from the date of the NHANES interview to the date of death or censoring.
Covariate variables
Independent variables for this study included demographic, socioeconomic, anthropometric, health behaviour and biomarkers of inflammation measures. Demographic variables included age (as a continuous variable), sex (male or female [reference: the category for each variable to which all other categories are compared]), veteran status (prior military service, non-prior military service[reference]), race/ethnicity (Mexican American, other Hispanic [defined as Hispanic individuals who do not identify as Mexican Americans], non-Hispanic Black, other race (including multiracial), non-Hispanic white [reference]) and marital status (married, widowed, divorced, separated, living with partner, missing, never married [reference]). Socioeconomic variables included income to poverty level (1.0 to 2.0 times poverty, 2.01 to 3.0 times poverty, 3.01 to 4.0 times poverty, more than 4.0 times poverty, missing and at or below poverty [reference]), and educational attainment (high school graduate or equivalent, some college, college graduate and more, missing, less than high school [reference]). Health behaviour and anthropometric variables included smoking status (former smoker, current smoker, missing, never smoked [reference]), participation in moderate recreational activities (yes, no [reference], unable to do, refused, missing), body mass index (BMI: underweight, overweight, obese and normal [reference]), a clinical-based high-risk threshold for high sensitivity-CRP (less than 3 mg/L [reference], greater than or equal to 3 mg/L, no measurement), clinically elevated HbA1c (less than 6.4% [reference], greater than or equal to 6.4%, no measurement) and hypertension (no, not elevated [reference], yes, elevated and missing).21
Hypertension assessment
The NHANES measures blood pressure directly during physical examination, recording the readings for three attempts. The mean of three attempts is used to calculate the final systolic and diastolic blood pressure. The NHANES questionnaire also contains items that ask for a self-reported diagnosis of hypertension from a medical professional (‘Have you ever been told that you have high blood pressure?’), and a self-reported indication of whether or not the participant is currently taking antihypertensive medication. Participants were classified as having hypertension if any of the following three indications were true: (1) direct blood pressure measures from physical examination met current American Heart Association criteria for hypertension; (2) self-reported diagnosis of hypertension by a medical professional; or (3) self-reported current use of antihypertensive medication.22
Dietary intake assessment
The computer-assisted dietary interview (CADI) system standardised the interview format to collect the dietary recall data.23 Energy, nutrients and non-nutrient foods were estimated from foods and beverages consumed during the 24-hour period prior to the interview (midnight–midnight).23 A multipass method interview format was used to collect the dietary information.23 In-person interviews were conducted in a private setting in the NHANES Mobile Examination Centers (MECs) by trained, bilingual interviewers.23 A second 24- hour dietary recall was conducted via telephone approximately 3–10 days after the MEC exam.24 The total energy (kcal), carbohydrate (gm), protein (gm), unsaturated fat (gm) and saturated fat (gm) variables were transformed into percentages of total intake for each nutrient. The percent ranges for the macronutrients were adapted from the Acceptable Macronutrient Distribution Ranges established by the Institute of Medicine (IOM) and the National Academy of Sciences, Engineering and Medicine.25,26 The IOM recommends that adults have 45–65% of their total calories from carbohydrates, 10–30% from protein and 20–35% from fat.25,26 To investigate the association of dietary fat, unsaturated and saturated fat variables were used. The 2020–2025 Dietary Guidelines for Americans (DGA) suggest consuming less than 10% of total calories from saturated fat.27,28 The saturated fat percent ranges were modelled after the DGA guidelines. Recommendations of up to 20–25% of total calories from unsaturated fat provided the adapted ranges for the unsaturated fat category.29
Statistical analysis
Descriptive statistics are reported as percentages for categorical variables with the Rao-Scott Chi-Square test for statistical comparisons. Age-adjusted all- cause mortality rates were plotted as bar graphs, and age-adjusted survival curves were plotted as line graphs using the Kaplan-Meier method, with a log-rank test for the difference between individuals with and without prior military service. Nested, multivariable proportional hazards regression models were used to analyse the data. The results are reported as hazard ratios (HR), 95% confidence intervals (CI), and P values. The proportional hazards assumption was tested, and results showed the assumption was not violated (Wald F = 0.053; P = 0.82). Collinearity was assessed using Spearman correlations (coefficients ranged from -0.01 to 0.27), and the results indicated no issues with collinearity. Statistical significance was set at α ≤ 0.05. All analyses were conducted using survey procedures and adjustments to account for population weighting and complex sample design. The IBM® SPSS Statistics Premium Grad Pack® version 27 (Armonk, NY, USA) was used for all statistical analyses.
Results
A total of 21 332 participants were included in the analysis. Characteristics of the study population are presented in Table 1. Females and males comprised 59.7% and 40.3% of the population without prior military service, respectively. The prior military service group was 93.4% men. For those with and without prior military service, more individuals were non-Hispanic white (83.2% and 70.8%), had some college education (33.6% and 29.9%), were married (69.9% and 56.1%) and overweight (41.8% and 33.0%), respectively. More prior military service members were former smokers (43.7% vs 22.7%) and participated in moderate physical activity (43.6% vs 41.7%) than those who did not serve. The all-cause mortality was 24.3% for prior military service members and 9.5% for individuals without previous military service, presented in Table 1. Age- adjusted mortality rates for all-cause mortality are shown in Figure 1, and age-adjusted survival curves are shown in Figure 2. Nutrition consumption as percentages is displayed in Table 2. Results for the nested multivariable regression models for all-cause mortality are presented in Table 3.
Figure 1
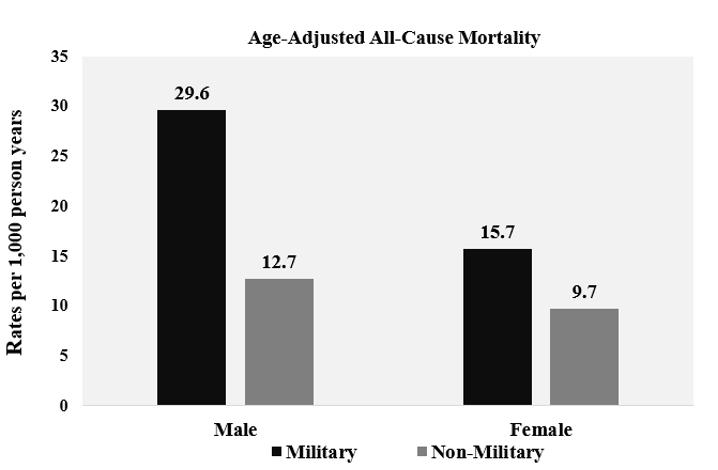
Table 1. Weighted Descriptive Statistics (n=21 332)
| Variable | Prior Military Service (n = 3154) |
No Prior Military Service (n = 18 178) |
P value |
|---|---|---|---|
| Age, mean | 57.7 | 44.9 | <0.001 |
| 18–24 | 1.8% | 10.5% | |
| 25–34 | 6.9% | 19.8% | |
| 35–44 | 13.1% | 22.1% | |
| 45–54 | 18.9% | 21.7% | |
| 55–64 | 22.2% | 12.1% | |
| 65 and over | 36.9% | 13.9% | |
| Sex | <0.001 | ||
| Men | 93.4% | 40.3% | |
| Women | 6.6% | 59.7% | |
| Race/ethnicity | <0.001 | ||
| Non-Hispanic white | 83.2% | 70.8% | |
| Mexican American | 2.5% | 8.3% | |
| Other Hispanic | 2.0% | 5.1% | |
| Non-Hispanic Black | 9.3% | 10.9% | |
| Other race (including multi-racial) |
3.0% | 5.0% | |
| Education level | <0.001 | ||
| Less than high school | 13.3% | 19.3% | |
| HS graduate or equivalent | 26.9% | 25.5% | |
| Some college | 33.6% | 29.9% | |
| College graduate or more | 26.2% | 25.3% | |
| Missing/unknown | 0.0% | 0.1% | |
| Income to poverty ratio | <0.001 | ||
| At or below poverty | 5.9% | 12.7% | |
| 1.0–2.0 times poverty | 17.3% | 19.4% | |
| 2.01–3.0 times poverty | 17.2% | 14.7% | |
| 3.01–4.0 times poverty | 15.5% | 13.7% | |
| More than 4.0 times poverty | 38.3% | 33.5% | |
| Missing | 5.8% | 6.0% | |
| Marital status | <0.001 | ||
| Never married | 7.7% | 17.1% | |
| Married | 69.9% | 56.1% | |
| Widowed | 5.3% | 6.2% | |
| Divorced | 10.1% | 9.5% | |
| Separated | 1.6% | 2.5% | |
| Living with a partner | 3.7% | 7.1% | |
| Missing | 1.7% | 1.5% | |
| Body Mass Index | <0.001 | ||
| Normal | 21.8% | 28.7% | |
| Underweight | 2.2% | 5.5% | |
| Overweight | 41.8% | 33.0% | |
| Obese | 34.2% | 32.9% | |
| Smoking status | <0.001 | ||
| Never smoked | 33.7% | 53.9% | |
| Current smoker | 22.5% | 23.3% | |
| Former smoker | 43.7% | 22.7% | |
| Missing | 0.0% | 0.0% | |
| Moderate recreational activity | 0.141 | ||
| Yes | 43.6% | 41.7% | |
| No | 33.4% | 31.8% | |
| Unable to do | 2.2% | 1.6% | |
| Refused | 0.0% | 0.0% | |
| Missing | 20.8% | 24.9% | |
| Clinically elevated CRP levels (mg/L) | |||
| Less than 3 | 63.7 % | 60.8% | |
| Greater than or equal to 3 | 32.8% | 33.8% | |
| No measurement | 3.5% | 5.4% | |
| Clinically elevated HbA1c | <0.001 | ||
| Greater than or equal to 6.4 | 9.1% | 5.9% | |
| Less than 6.4 | 87.6% | 89.1% | |
| No measurement | 3.3% | 4.9% | |
| Hypertension | <0.001 | ||
| Yes, elevated | 63.9 % | 46.1% | |
| No, not elevated | 34.1% | 50.4% | |
| Missing | 2.0% | 3.6% | |
| All-cause mortality | <0.001 | ||
| Alive | 75.7% | 90.5% | |
| Dead | 24.3% | 9.5% | |
| Mortality follow up time in years, mean | 10.2 | 10.7 | <0.001 |
Table 2. Macronutrient intake by military service (n = 21 332)
| Variable | Prior Military Service (n = 3154) | Non-Military Service (n = 18 178) | P value |
|---|---|---|---|
| Saturated fat | <0.001 | ||
| Less than 5% | 2.2% | 3.1% | |
| 5% thru 9% | 22.0% | 24.4% | |
| >9% thru 11% | 23.0% | 24.3% | |
| Greater than 11% | 52.7% | 48.3% | |
| Unsaturated fat | <0.001 | ||
| >0% thru 15% | 7.6% | 8.2% | |
| >15% thru 20% | 20.4% | 25.1% | |
| >20% thru 25% | 36.5% | 35.8% | |
| Greater than 25% | 35.6% | 30.9% | |
| Carbohydrate | <0.001 | ||
| Less than 40% | 69.5% | 68.5% | |
| 40% thru 45% | 9.9% | 10.5% | |
| >45% thru 50% | 6.5% | 6.7% | |
| >50% thru 55% | 5.5% | 4.9% | |
| Greater than 55% | 8.4% | 9.3% | |
| Protein | <0.001 | ||
| ≤10% | 6.1% | 6.4% | |
| >10% thru <15% | 39.5% | 40.8% | |
| 15% thru <20% | 40.9% | 39.0% | |
| 20% thru 25% | 11.0% | 10.7% | |
| Greater than 25% | 2.5% | 3.1% | |
| Calories | <0.001 | ||
| <800 | 1.0% | 2.2% | |
| ≥800 and <1200 | 5.4% | 9.5% | |
| ≥1200 and <1500 | 9.3% | 14.0% | |
| ≥1500 and <1800 | 12.9% | 15.8% | |
| ≥1800 and <2000 | 10.3% | 10.1% | |
| ≥2000 and <2200 | 11.3% | 9.3% | |
| ≥2200 and <2500 | 13.7% | 11.0% | |
| 2500 and greater | 36.1% | 28.1% |
Figure 2
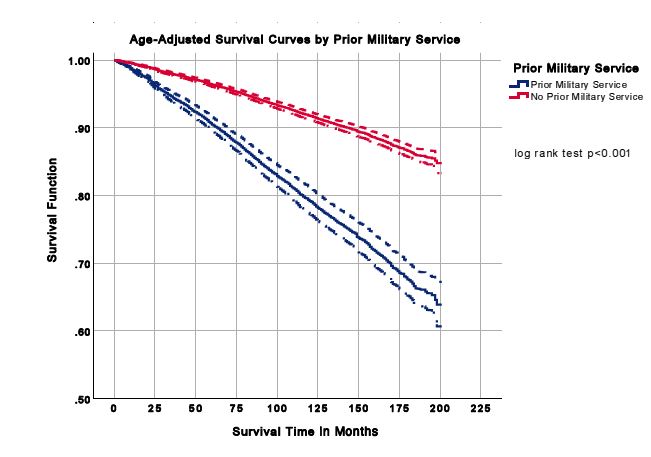
Table 3. Unadjusted and multivariable adjusted cox proportional hazards models for all-cause mortality (n = 21 332)
| Variable | Model 1: Age-adjusted prior military status HR (95% CI); P value |
Model 2: Adjusted for demographic, SES & health behaviours HR (95% CI); P value |
Model 3: Fully adjusted with biomarkers HR (95% CI); P value |
|---|---|---|---|
| Military status | |||
| Prior military service | 1.31 (1.18, 1.46); <0.001 | 1.09 (0.97, 1.23); 0.128 | 1.10 (.98, 1.24); 0.105 |
| No prior military service (ref) | |||
| Age | 1.08 (1.08, 1.09); <0.001 | 1.09 (1.09, 1.10); <0.001 | 1.08 (1.08, 1.09); <0.001 |
| Sex | |||
| Men | 1.71 (1.54, 1.91); <0.001 | 1.74 (1.55, 1.95); <0.001 | |
| Women (ref) | |||
| Race/ethnicity | |||
| Non-Hispanic white (ref) | |||
| Mexican American | 1.63 (0.99, 1.36); 0.061 | 1.23 (0.96, 1.32); 0.155 | |
| Other Hispanic | 0.801 (0.63, 1.02); 0.075 | 0.764 (0.60, 0.97); 0.026 | |
| Non-Hispanic Black | 1.05 (0.94, 1.19); 0.368 | 0.941 (0.83, 1.07); 0.348 | |
| Other race (including multi-racial) | 1.00 (0.68, 1.48); 0.980 | 0.927 (0.63, 1.36); 0.693 | |
| Education Level | |||
| Less than high school (ref) | |||
| HS graduate or equivalent | 0.968 (0.86, 1.09); 0.579 | 0.987 (0.88, 1.11); 0.832 | |
| Some college | 0.920 (0.81, 1.05); 0.201 | 0.937 (0.82, 1.07); 0.335 | |
| College graduate or more | 0.682 (0.58, 0.81); <0.001 | 0.714 (0.60, .84); <0.001 | |
| Missing/unknown | 2.01 (0.92, 4.40); .079 | 2.12 (0.96, 4.69); 0.063 | |
| Income to poverty ratio | |||
| At or below poverty (ref) | |||
| 1.0–2.0 times poverty | 0.859 (0.75, 0.99); 0.034 | 0.884 (0.77, 1.02); 0.090 | |
| 2.01–3.0 times poverty | 0.830 (0.72, 0.96); 0.013 | 0.866 (0.75, 1.00); 0.061 | |
| 3.01–4.0 times poverty | 0.735 (0.60, 0.91); 0.005 | 0.767 (0.62, 0.94); 0.013 | |
| More than 4.0 times poverty | 0.568 (0.47, 0.68); <0.001 | 0.596 (0.49, 0.72); <0.001 | |
| Missing | 0.884 (0.71, 1.10); 0.271 | 0.913 (0.73, 1.14); 0.418 | |
| Marital status | |||
| Never married (ref) | |||
| Married | 0.644 (0.54, .78); <0.001 | 0.645 (0.54, 0.77); <0.001 | |
| Widowed | 0.843 (0.70, 1.02); 0.075 | 0.851 (0.70, 1.03); 0.100 | |
| Divorced | 0.866 (0.70, 1.07); 0.180 | 0.841 (0.67, 1.05); 0.121 | |
| Separated | 0.841 (0.59,1.19); 0.325 | 0.845 (0.59, 1.20); 0.345 | |
| Living with a partner | 0.791 (0.57, 1.10); 0.163 | 0.800 (0.58, 1.11); 0.179 | |
| Missing | 0.718 (0.52, 1.00); 0.047 | 0.714 (0.51, 1.00); 0.053 | |
| BMI category | |||
| Normal (ref) | |||
| Underweight | 1.43 (1.17, 1.75); 0.001 | 1.49 (1.22, 1.83); <0.001 | |
| Overweight | 0.933 (0.83, 1.05); 0.242 | 0.877 (0.79, 0.98); 0.019 | |
| Obese | 1.07 (0.97, 1.20); 0.167 | 0.915 (0.82, 1.02); 0.105 | |
| Smoking status | |||
| Never smoked (ref.) | |||
| Current smoker | 2.05 (1.82, 2.33); <0.001 | 2.01 (1.78, 2.28); <0.001 | |
| Former smoker | 1.25 (1.12, 1.40); <0.001 | 1.24 (1.11, 1.40); <0.001 | |
| Missing | 0.197 (0.03, 1.30); 0.091 | 0.224 (0.04, 1.44); 0.113 | |
| Moderate PA | |||
| No (ref.) | |||
| Yes | 0.798 (0.72, .88); <0.001 | 0.807 (0.73, .89); <0.001 | |
| Unable to do | 1.95 (1.61, 2.36); <0.001 | 1.95 (1.62, 2.36); <0.001 | |
| Refused to answer/Don’t know | 0.844 (0.15, 4.70); 0.845 | 0.682 (0.14, 3.41); 0.637 | |
| Missing | 0.940 (0.79, 1.12); 0.482 | 0.939 (0.80, 1.11); 0.443 | |
| Saturated fat | |||
| Less than 5% | 1.05 (0.83, 1.33); 0.686 | 1.03 (0.82, 1.32); 0.761 | |
| 5% thru 9% (ref) | |||
| >9% thru 11% | 1.00 (0.87, 1.15); 0.961 | 1.00 (0.87, 1.15); 0.995 | |
| Greater than 11% | 1.14 (1.03, 1.27); 0.015 | 1.13 (1.02, 1.26); 0.022 | |
| Unsaturated fat | |||
| >0% thru 15% | 1.01 (0.89, 1.15); 0.850 | 1.02 (0.90, 1.17); 0.712 | |
| >15% thru 20% (ref) | |||
| >20% thru 25% | 0.927 (0.83, 1.04); 0.177 | 0.919 (0.83, 1.02); 0.115 | |
| Greater than 25% | 0.918 (0.81, 1.04); 0.183 | 0.896 (0.79, 1.02); 0.086 | |
| Carbohydrate | |||
| Less than 40% | 1.05 (0.92, 1.21); 0.411 | 1.05 (0.92, 1.21); 0.442 | |
| 40% thru 45% (ref) | |||
| >45% thru 50% | 1.00 (0.82, 1.23); 0.963 | 1.02 (0.83, 1.25); 0.849 | |
| >50% thru 55% | 1.09 (0.86, 1.39); .0457 | 1.08 (0.85, 1.38); 0.515 | |
| Greater than 55% | 1.07 (0.90, 1.29); 0.440 | 1.03 (0.86, 1.25); 0.720 | |
| Protein | |||
| ≤10% | 1.30 (1.05, 1.61); 0.016 | 1.37 (1.12, 1.69); 0.003 | |
| >10% thru <15% | 1.08 (0.92, 1.28); 0.332 | 1.13 (0.96, 1.34); 0.132 | |
| 15% thru <20% | 1.02 (0.89, 1.18); 0.724 | 1.05 (0.92, 1.21); 0.458 | |
| 20% thru 25% (ref) | |||
| Greater than 25% | 0.980 (0.72, 1.33); 0.892 | 0.941 (0.69, 1.28); 0.694 | |
| Calories | |||
| <800 | 1.21 (0.93, 1.59); 0.146 | 1.19 (0.93, 1.54); 0.163 | |
| ≥800 and <1200 | 1.11(0.97, 1.17); 0.112 | 1.11 (0.97, 1.27); 0.121 | |
| ≥1200 and <1500 | 0.983 (0.85, 1.14); 0.729 | 1.03 (0.91, 1.17); 0.643 | |
| ≥1500 and <1800 | 0.872 (0.73, 1.04); 0.812 | 0.978 (0.85, 1.12); 0.754 | |
| ≥1800 and <2000 (ref) | |||
| ≥2000 and <2200 | 0.872 0(0.73, 1.04); 0.124 | 0.887 (0.75, 1.05); 0.163 | |
| ≥2200 and <2500 | 0.928 0(0.80, 1.07); 0.306 | 0.940 (0.82, 1.08); 0.384 | |
| 2500 and greater | 0.846 (0.72, .99); 0.039 | 0.868 (0.75, 1.01); 0.068 | |
| Clinically elevated CRP levels (mg/L) | |||
| Less than 3 (ref) | |||
| Greater than or equal to 3 | 1.31 (1.20, 1.44); <0.001 | ||
| No Measurement | 1.61 (0.96, 2.72);0 .068 | ||
| Clinically elevated HbA1c (%) | |||
| Less than 6.4 (ref) | |||
| Greater than or equal to 6.4 | 1.63 (1.46, 1.82); <0.001 | ||
| No measurement | 1.19 (0.68, 2.08); 0.532 | ||
| Hypertension | |||
| No, not elevated (ref) | |||
| Yes, elevated | 1.21 (1.10, 1.35); <0.001 | ||
| Missing | 1.59 (1.16, 2.20); 0.004 |
All-cause mortality
In the age-adjusted model, prior military service members were 1.3 times (HR, 1.31; 95% CI, 1.18– 1.46; P < 0.001) more likely to be at greater risk of all-cause mortality than those without previous military service, Table 3, Model 1. When controlling for demographics, socioeconomic, and health behaviour variables, prior military service was not statistically associated with a higher risk of all- cause mortality, Table 3, Model 2. The association remained not significant in the fully adjusted model, Table 3, Model 3.
After adjusting for demographic, socioeconomic and health behaviour variables, males were at an increased risk of all-cause mortality (HR, 1.71; 95% CI, 1.54–1.91; P < 0.001) than females, presented in Table 3, Model 2. Additional socioeconomic variables that were statistically significant were college graduates and individuals with greater education (HR, 0.682; 95% CI, 0.58–0.81; P < 0.001) and married (HR, 0.644; 95% CI, 0.54–0.78; P <0.001). Individuals with a higher income had a lower risk of all-cause mortality than those living at or below poverty, individuals at: >1–2 times poverty (HR, 0.859; 95% CI, 0.75–0.99; P = 0.034), >2–3 times poverty (HR, 0.830; 95% CI, 0.72–0.96; P = 0.013), >3–4 times poverty (HR, 0.735; 95% CI, 0.60–0.91; P = 0.005), >4 times poverty (HR, 0.568; 95% CI, 0.47–0.68; P < 0.001). Additional health behaviour variables that were statistically significant were underweight (HR, 1.43; 95% CI, 1.17–1.75; P = 0.001), current smoker (HR, 2.05; 95% CI, 1.82–2.33; P < 0.001), former smoker (HR, 1.25; 95% CI, 1.12–1.40; P < 0.001), individuals who participated in moderate physical activity (HR, 0.798; 95% CI, 0.72–0.88; P < 0.001), those who were unable to do moderate physical activity (HR, 1.95; 95% CI, 1.61–2.36; P < 0.001). Dietary intake variables that were statistically significant were saturated fat consumption greater than 11% of total calories (HR, 1.14; 95% CI, 1.03–1.27; P = 0.015), protein intake less than or equal to 10% of total calories (HR, 1.30; 95% CI, 1.05–1.61; P = 0.016), and 2500 and greater calorie consumption (HR, 0.846; 95% CI,.72–0.99; P = 0.039). Race/ethnicity, unsaturated fat and carbohydrate variables were not statistically significant.
In the fully adjusted model, the increased risk of all-cause mortality for males remained significant (HR, 1.74, 95% CI, 1.55–1.95; P < 0.001), Table 3, Model 3. The other Hispanic group had a significantly lower risk for all-cause mortality (HR, 0.764, 95% CI, 0.60–0.97; P = 0.026), while Mexican Americans were not significantly different from non-Hispanic whites. This is an important observation vis-à-vis the Hispanic Paradox whereby Hispanics have similar or lower mortality rates than non-Hispanic whites even with a lower SES.30 Other statistically significant factors were college graduates and those with greater education (HR, 0.714; 95% CI, 0.60–0.84; P < 0.001), >3–4 times poverty (HR, 0.767; 95% CI, 0.62–0.94; P = 0.013), >4 times poverty (HR, 0.596; 95% CI, 0.49–0.72; P < 0.001) and married (HR, 0.645; 95% CI, 0.54–0.77; P < 0.001). Health behaviours that were also statistically significant were underweight (HR, 1.49; 95% CI 1.22–1.83; P < 0.001), overweight (HR, 0.877; 95% CI, 0.79–0.98, P = 0.019), current and former smokers (HR, 2.01; 95% CI, 1.78–2.28; P < 0.001) (HR, 1.24; 95% CI, 1.11–1.40; P < 0.001), respectively, participation in moderate activity (HR, 0.807, 95% CI, 0.73–0.89; P < 0.001) and unable to do moderate physical activity (HR, 1.95; 95% CI, 1.62–2.36, P < 0.001), saturated fat intake greater than 11% of total calories (HR, 1.13; 95% CI, 1.02–1.26; P = 0.022) and protein intake less than or equal to 10% of total calories (HR, 1.37; 95% CI, 1.12–1.69; P = 0.003). Individuals with clinically elevated CRP levels greater than 3 mg/L were 1.3 times more likely (HR, 1.31; 95% CI, 1.20–1.44; P < 0.001) to be at an increased risk of all-cause mortality than individuals with CRP levels less than 3 mg/L. Individuals with clinically elevated HbA1c greater than 6.4% were 1.6 times more likely (HR, 1.63; 95% CI, 1.46–1.82; P < 0.001) to be at an increased risk of all-cause mortality than individuals with HbA1c levels less than 6.4%. Individuals with elevated hypertension were 1.2 times (HR, 1.21; 95% CI, 1.10–1.35; P < 0.001) more likely to be at an increased risk of all-cause mortality than individuals without elevated hypertension. The per cent of calorie intake from unsaturated fat, carbohydrate and total energy variables were not statistically significant.
Discussion
The findings supported the primary hypothesis that individuals with prior military service had a greater age-adjusted risk of all-cause mortality than civilians. In the subsequent hypothesis, the military and all-cause mortality association was attenuated by the inclusion of additional demographic, socioeconomic and health behaviour variables. After adjusting for demographic, socioeconomic, health behaviours and measures of inflammation (CRP, HbA1c and hypertension), the associations between prior military service and all-cause mortality were completely attenuated. Previous research has described a complex and multifactorial influence of military service on health outcomes, which is patterned by subsequent socioeconomic and behavioural factors.30 These findings are consistent with a socioeconomic and behavioural explanation for mortality differences between individuals with prior military service and individuals without prior service. Prolonged exposure to military operational stressors, deployments and combat may also contribute to ‘weathering’, which has been linked to an increased risk of chronic diseases and mortality.5,31-34 However, this study did not have access to these measures.
Dietary factors
The results partially support the hypothesis that there is an association between dietary intake and all-cause mortality. The findings were consistent with previous research that demonstrated a higher mortality risk in underweight individuals.35 Calorie deprivation is a primary contributor to an increased mortality rate in underweight individuals.36 Also, micronutrient consumption is less when energy intake is low, leading to higher general morbidity and mortality.37,38 In addition to poor nutritional status, smoking behaviours have also been associated with a higher risk of mortality in those with an underweight BMI status.35,3935,39 Notably in the observation, the underweight and higher risk of all-cause mortality association remained significant after adjusting for smoking behaviours. However, residual confounding can still be present.
Overweight individuals were significantly associated with a lower risk of all-cause mortality than those in the normal BMI category. A previous systematic review used standard BMI categories and self- reported and measured data for height and weight to demonstrate that the overweight and lower risk of all-cause mortality relationship support the observation.40 Yet, these findings contrast a meta- analysis of prospective studies that reported a significant association of overweight status with a higher mortality risk across four continents.41 An increase in body weight can also result in nutrient deficiencies resulting in diet-related chronic diseases and mortality.42 Overweight status as a protective or harmful predictor of mortality remains debatable.
The study demonstrated a significant association between increased saturated fat consumption and a higher risk of all-cause mortality. Similar to the findings, higher consumption of saturated fats was significantly associated with increased mortality.43,44 In a substitutional analysis, replacing 5% of total energy from saturated fat with poly- and monounsaturated fats of equal energy resulted in a decrease in total mortality of 27% and 13%, respectively.43 In the fully adjusted model, the saturated fat and all-cause mortality association remained statistically significant. These data suggest that saturated fat was associated with a greater all- cause mortality risk independent of other health behaviours and biomarkers of inflammation. The findings support the less than 10% of total energy for saturated fat recommendation by the US DGA.27 Given that saturated fat intake by US individuals exceeds these recommendations, the results are also clinically important.45 Unlike prior research, there was not a significant association between unsaturated fat and the risk of all-cause mortality.44
Carbohydrate consumption was not significantly associated with the risk of all-cause mortality. However, previous literature demonstrated that both low (<40%) and high (>70%) percentages of energy from total carbohydrates were associated with increased mortality, and a minimal risk was seen among individuals with a 50–55% carbohydrate intake.46 Of interest, the carbohydrate consumption and mortality association was modified by the macronutrient source. Specifically, a low-carbohydrate dietary pattern replaced with an animal-based protein/fat source demonstrated a higher risk of mortality than a plant-derived protein/ fat substitution.46
Individuals who consumed less than or equal to 10% of total calories from protein were significantly associated with a higher risk of all-cause mortality than individuals who consumed 20–25% of total calories from protein. In the fully adjusted model, the association between less than or equal to 10% of total energy from protein and the greater risk of all-cause mortality remained statistically significant. This finding suggests that lower protein consumption served as an independent risk factor for greater all- cause mortality risk, regardless of other factors. The observation is supported by previous research that noted that all-cause mortality increased when protein consumption was less than 10%.47 The effects of protein deficiency can range from muscle wasting, impaired mental health, weakened immune system and organ failure to mortality.48 In the US, protein malnutrition is not a prevalent concern.49 In a CDC dietary intake report, the mean protein consumption by adults met the acceptable intake set by the National Academy of Medicine.50 It is worth mentioning that prior studies demonstrated that a greater intake of animal protein was associated with higher mortality, and plant-based protein consumption was associated with lower mortality.46,51 This is of concern because protein derived from animal sources, such as red and processed meat, is consumed more than plant protein sources by Americans.45
Adjusting for health behaviours, the consumption of 2500 calories and greater served as a protective factor for the risk of all-cause mortality. However, after controlling for the biomarkers of inflammation, the association did not remain significant. The findings contrast the notion that energy intake can induce oxidative stress and inflammation.52 Elevated inflammatory markers have been associated with the pathogenesis of chronic diseases and are driven by excess caloric consumption.53-56 Conversely, calorie restriction (less than 10–50% of usual intake) has been shown to improve longevity and decrease the risk factors for chronic diseases such as diabetes and CVD.52,57Another study found a 25% calorie reduction for 28 days decreased biomarkers of oxidative stress in obese individuals.52,58 Also, body weight and body fat loss were associated with a reduction in markers of inflammation.58 These observations support further research into whether changes in biomarkers of inflammation are attributed to weight loss or energy intake.
Proximate indicators of morbidity and inflammation
The results supported the final hypothesis that the inclusion of elevated biomarkers of inflammation, elevated HbA1c values and measures of hypertension would attenuate the dietary intake-mortality association. Individuals with clinically elevated hs- CRP levels were associated with a greater all-cause mortality risk than individuals with less than a 3 mg/L value. CRP, a plasma protein, is a well-established systemic inflammatory marker commonly used in clinical practice.59-61 Studies have shown elevated CRP levels to be independent predictors of all-cause mortality in the general population and individuals with type 2 diabetes.61,62
Individuals with an HbA1c value greater than 6.4% had a significantly greater risk of all-cause mortality than individuals with less than a 6.4% value. The inclusion of at least a pre-diabetes classification is also clinically significant. Not only do individuals with impaired glucose tolerance already present with diabetes-related chronic complications and are near or maximally insulin resistant, but the study findings demonstrate they are also at a higher risk of all-cause mortality.63 Type 2 diabetes is associated with insulin resistance resulting in the increased production of inflammatory markers such as CRP.64,65 The dysregulation of the inflammatory process is the underlying mechanism of major chronic diseases. For example, hyperglycaemia increases the production of reactive oxygen species (ROS), leading to inflammation and endothelial dysfunction.66,67
There was a statistically significant association between individuals with hypertension and a greater risk of all-cause mortality than individuals without hypertension. The results are supported by previous research on cardiovascular health metrics and all- cause mortality in US adults using data from the NHANES.68 The greater number of cardiovascular health metrics (e.g., normal blood pressure) met by participants was associated with a significantly reduced risk of all-cause mortality.68 This association remained across age, sex, race/ethnicity and educational attainment.68
Demographic, socioeconomic and behavioural factors
Adjusted for demographic, socioeconomic and health behaviours, men had a greater risk of all-cause mortality than women. These results remained significant after being fully adjusted with the measures of inflammation, metabolic and cardiovascular biomarkers. By race/ethnicity, individuals in the other Hispanic category had a lower risk of all-cause mortality than non-Hispanic whites. These findings are consistent with previous research demonstrating lower mortality rates in US Hispanics than non-Hispanic whites in the general population after adjusting for age.69 Notably, the results suggest no advantage for all-cause mortality in the Mexican American group. In addition to the Hispanic Paradox, another possible explanation for the Hispanic mortality advantage could be attributed to Hispanics’ lower level of smoking compared to non- Hispanic whites.69,70 Of note, non-Hispanic Blacks were not observed to have a higher risk of all-cause mortality than non-Hispanic whites. This contrasts with previous research that highlighted Black Americans have greater adverse health outcomes related to chronic disease and premature death.71
Individuals with the highest educational attainment were associated with a lower risk of all-cause mortality than those with less than a high school education. The results are supported by previous research on the education-mortality association demonstrating longer life expectancy with more educated individuals.72,73 Individuals with a higher income had a lower risk of all-cause mortality than those living at or below poverty. The findings were consistent with previous income inequality and mortality relationship research. Individuals with a low SES struggle with more chronic diseases and have lower life expectancy than individuals in a greater SES position.74-77 Marriage demonstrated a statistically significant association with a lower risk of all-cause mortality than individuals who never married. Marriage has been shown to be a protective factor in health outcomes and mortality compared to individuals who were not married.78-80 Smokers and former smokers demonstrated a higher risk of all- cause mortality than individuals who never smoked. Overall mortality among US adult smokers is about three times greater than non-smokers.81 Physical activity demonstrated a protective factor for all-cause mortality risk. Individuals unable to participate in moderate physical activity had a greater risk of all-cause mortality than those who did not report any physical activity. A previous study found that participation in at least moderate-intensity physical activity 3 hours per week was associated with a 27% decreased mortality risk in US adults.82
Limitations
The study has several limitations. The NHANES is a cross-sectional study, which limits the ability to attribute a causal relationship. The limited NHANES data did not allow the examination of specific military-related factors, such as deployment and combat-related exposures, which could influence the prevalence of chronic disease risks and mortality in veterans. A cross-sectional study does not reflect past or longitudinal nutritional consumption or changes in biomarkers over time. Individuals’ dietary intake can vary daily. Longitudinal studies are needed to assess health behaviours and biomarkers over time. Further research should investigate the effectiveness of an anti-inflammatory diet on biomarkers of inflammation among military members. Inaccurate reporting or poor memory of participants can raise concerns about the accuracy of the dietary data. Measurement errors can still occur by the interviewers. BMI is an indirect measure of body fat. Therefore, participants might be misclassified as overweight or obese. Alternative anthropometric methods (e.g., bioelectrical impedance and skinfold thickness) could further explain the association between body composition and mortality. The limited sample size did not allow for cause-specific analysis. Further research would benefit from larger samples for an investigation into cause-specific mortality. Finally, these findings may not be generalisable to all military Veterans as access to the data was only available in the NHANES, which was limited to data collected from 1999–2008. Food insecurity is a significant problem in the US veteran population.83 More studies should focus on the prevalence of food insecurity, its risk factors and how food insecurity can impact dietary patterns and veterans’ health outcomes.
Conclusion
This study found that prior military service was not associated with a higher all-cause mortality after adjustment for demographic, socioeconomic and health behaviour variables. Under consumption of protein and overconsumption of saturated fat was associated with a higher risk of all-cause mortality, independent of other factors. Clinically elevated CRP levels, HbA1c and an indication of hypertension were associated with an increased all-cause mortality risk. These biomarkers attenuated the all-cause mortality and total energy intake association.
Corresponding Author: S. Ansley, deleons3@livemail.uthscsa.edu
Authors: S. Ansley1, J. Howard1
Author Affiliations:
1 The University of Texas at San Antonio – Department of Public Health