


Introduction
The US veteran population is shrinking in size while its age composition is also changing1,2 As earlier generations pass away, more recent cohorts account for a growing share of veterans entering older adulthood, when chronic disease and functional limitations become more common. Whether these cohorts are reaching older ages in better or worse health than their predecessors has important implications for the health systems that serve them. If more recent veteran cohorts develop chronic illness at younger ages, the total years lived with disease, disability and functional limitation could remain high or even increase despite a declining veteran population.
This paper contrasts three US birth cohorts to answer the question: when observed at the same (older) ages, do more recent veteran cohorts report fewer or more chronic conditions and health problems than earlier cohorts? To answer this question, we use the Health and Retirement Study (HRS) from 1992 through 20223 and compare birth cohorts 1931–1941, 1943–1953 and 1955–1965. We examine self-rated overall health status and seven chronic medical conditions consistently measured in the HRS: arthritis, cancer, chronic lung disease, diabetes, heart disease, high blood pressure and stroke.
The HRS is a nationally representative longitudinal survey of US adults age 50 and older that follows multiple birth cohorts and periodically refreshes the sample by adding newly age-eligible cohorts. This design permits age-aligned cross-cohort comparisons. Rather than comparing younger and older veterans at a single point in time or examining secular trends over calendar time, we compare different birth cohorts when they are observed at the same ages.
By asking whether more recent veteran cohorts report different prevalences of these diagnosed conditions than earlier cohorts did at comparable ages, we are uncommonly slicing the data. Most prior work has been either cross-sectional, comparing groups at the same point in time, or longitudinal, following individuals over time without explicitly aligning cohorts by age. We did not identify a similar study using nationally representative longitudinal data to compare chronic disease prevalence across US veteran cohorts at identical ages.
Some previous studies have compared veterans from different service eras, but generally without age alignment. Fontana and Rosenheck compared World War II, Korean War and Vietnam War veterans. They found that mental health symptoms are less severe the older veterans are and that symptom levels differ across conflict eras.4 The Veteran Identity Program Survey 2001 compared World War II, Vietnam-era, Korean Conflict and Persian Gulf War veterans, but at the same point in time and therefore at different ages. World War II veterans were more likely to report poor health status and functioning, and Vietnam-era veterans reported more difficulty with specific activities of daily living and instrumental activities of daily living than any other era of veterans.5 The study closest to ours used HRS data through 2006, but focused primarily on veterans versus nonveterans rather than direct cohort contrasts among veterans.6 That analysis used model-based predictions of chronic conditions and limitations, suggesting that veterans had better health than nonveterans at age 66 but then experienced greater age-related deterioration. With respect to cohort differences, the estimates suggested that Vietnam-era veterans would be in poorer health at age 66 but then deteriorate less than earlier veteran cohorts. The HRS has since collected an additional 16 years of data, and we provide data on actual experiences rather than model predictions.
Health trajectories may differ across veteran cohorts for many reasons. Successive cohorts experienced different military eras, combat and occupational exposures, smoking environments, obesity risk, labour market trajectories and healthcare systems. More recent cohorts also matured in a broader US context marked by rising obesity, diabetes and multimorbidity. At the same time, medical screening and diagnostic practices have changed, complicating interpretation of differences in diagnosed disease prevalence across cohorts.
These competing forces make the direction of cohort differences uncertain. More recent cohorts could reach older adulthood in better or worse health, or simply with more diagnosed illnesses than previously undetected illnesses. This is especially important when interpreting diagnosed conditions in survey data. Higher prevalence may reflect greater underlying morbidity, but it may also reflect broader screening, earlier detection or changing diagnostic thresholds. For this reason, condition-specific comparisons are more informative than simple counts of diagnoses and can be interpreted in light of changing clinical practice.
Two conditions are especially sensitive to screening and detection: high blood pressure and diabetes, both often asymptomatic in their early stages. Awareness, treatment and control of high blood pressure have increased substantially over time.7 Diabetes screening has also expanded, with broader criteria and increased use of haemoglobin A1c testing. Nevertheless, diabetes has increased substantially in the US population and not merely because of improved detection.8 The prevalence of conditions whose diagnosis depends on symptoms would be less affected by detection rates and not inherently increase. In fact, the prevalence of chronic obstructive pulmonary disease in the US has declined until 2011 and since then has been stable.9 Stroke and heart disease mortality have also declined, partly because of reduced smoking and improved treatment of blood pressure and cholesterol.10,11 Arthritis diagnoses are driven by patient-reported symptoms, unlike screening for asymptomatic conditions like high blood pressure. Diagnosed arthritis prevalence has increased over time, a trend expected to continue as a consequence of higher obesity rates.12
Against this background, our aim is descriptive but important: to determine whether more recent veteran cohorts are entering older adulthood with a higher burden of diagnosed chronic illness and worse self-rated health than earlier cohorts when observed at the same ages.
Methods
The Health and Retirement Study (HRS) is a nationally representative longitudinal panel survey of US adults age 50 and over, designed to examine health, economic status and aging.3 Initiated in 1992 and conducted biennially by the University of Michigan’s Institute for Social Research, the HRS is sponsored by the National Institute on Aging (NIA) and the Social Security Administration (SSA).
The HRS employs a multistage area‑probability sampling design of households in the contiguous United States, with oversamples of Black and Hispanic respondents to ensure adequate representation of minority populations. The original 1992 cohort included individuals born between 1931 and 1941 and their spouses or partners, regardless of age.13 Subsequent cohorts have been added approximately every six years to maintain representativeness of the US population over age 50. As of the most recent wave, the HRS sample includes more than 20 000 respondents across multiple birth cohorts, enabling both cross‑sectional and longitudinal analyses.14
Interviews are conducted every two years, primarily through computer‑assisted personal interviews (CAPI) and telephone follow‑ups. The survey collects information on physical and mental health, functional status, health behaviours, cognitive functioning, employment, income, wealth, family structure and healthcare utilisation.13
Outcome variables
At each biennial interview, respondents are asked whether a doctor has ever told them that they had specific chronic conditions. The exact wording depends on whether this is a first interview and whether the condition was reported at a prior interview. The conditions are (with the abbreviated term used in this paper in parentheses):
1) high blood pressure or hypertension (high blood pressure)
2) diabetes or high blood sugar (diabetes)
3) cancer or a malignant tumour of any kind except skin cancer (cancer)
4) chronic lung disease except asthma, such as chronic bronchitis or emphysema (lung disease)
5) heart attack, coronary heart disease, angina, congestive heart failure, or other heart problems (heart disease)
6) stroke or transient ischaemic attack (stroke)
7) arthritis or rheumatism (arthritis).
Self-reported health is used to assess overall health. We collapse the five-response category (excellent, very good, good, fair, poor) into a 0–1 indicator of fair/poor health.
Stratification by birth cohort
We distinguish three groups: born in 1931–1941, 1943–1953 and 1955–1965. This grouping aligns best with the HRS design and replenishment. New groups of adults aged 50 and over are introduced into the HRS every 6 years (i.e., once every three waves). The first cohort, known as the ‘HRS Cohort’ was introduced in 1992 and included individuals born between 1931 and 1941, an 11-year age range. Subsequent replenishing cohorts were added every three waves. The first replenishing cohort added was the War Babies (WB) cohort, representing those born between 1942 and 1947, followed by Early Baby Boomers (EBB, born 1948–1953), the Middle Baby Boomers (MBB, born 1954–1959), the Late Baby Boomers (LBB, born 1960–1965), the Early Generation X (EGenX, born 1966–1971). Two earlier groups (born before 1930, Coda and AHEAD) were added separately.
The original HRS Cohort spans 11 years, and we wanted to match this window with later cohorts. We combined two replenishing cohorts to create a group with a 12-year window, then dropped individuals in the first birth year, resulting in a cohort with an 11-year window that matches the original HRS Cohort. The resulting one-year gap between our analysis cohorts improves the contrast. We focus on comparing three groups: The original HRS Cohort (Cohort 1, born 1931–1941), WB+EBB minus the first year (Cohort 2, born 1943–1953), and MBB+LBB minus the first year (Cohort 3, born 1955–1965). Individuals serving during the Korean War would be in Cohort 1; Vietnam-era veterans in Cohort 2; and Gulf War veterans in Cohort 3.
Statistical methods
We present weighted descriptive statistics using the HRS baseline interview weight. Results are shown as cohort-specific prevalence estimates with 95% confidence intervals. We compare cohorts at identical ages using overlapping age bands and summarise differences as prevalence ratios. For example, a Cohort 3 to Cohort 1 prevalence ratio of 1.40 indicates that prevalence in Cohort 3 is 40% higher than in Cohort 1 at the same age range. To avoid confusion with absolute prevalence rates, we do not use ‘per cent’ when comparing relative changes; instead express them as ratios.
Figures are presented using condition-specific y-axis scales rather than a uniform 0 to 100 scale. This improves interpretability because prevalence differs greatly across conditions. Arthritis and high blood pressure are common and eventually affect a large share of respondents, whereas stroke remains relatively uncommon. A common 0 to 100 scale would compress meaningful cohort differences for less prevalent conditions.
Cohort 3 had not yet reached the full age ranges 59–69 and 61–71 by the most recent survey wave and is therefore not shown for those age groups. Estimates are based on respondents observed and alive in each age range; they are not adjusted for mortality. Accordingly, the results describe the burden of diagnosed disease among veterans who survived to those ages and were available for interview. Although mortality remains limited in our oldest age group relative to much older populations, selective survival may still affect estimates because veterans in poorer health are less likely to survive into later age ranges. The findings should therefore be interpreted as the disease burden among veterans alive and potentially in need of services at those ages.
Results
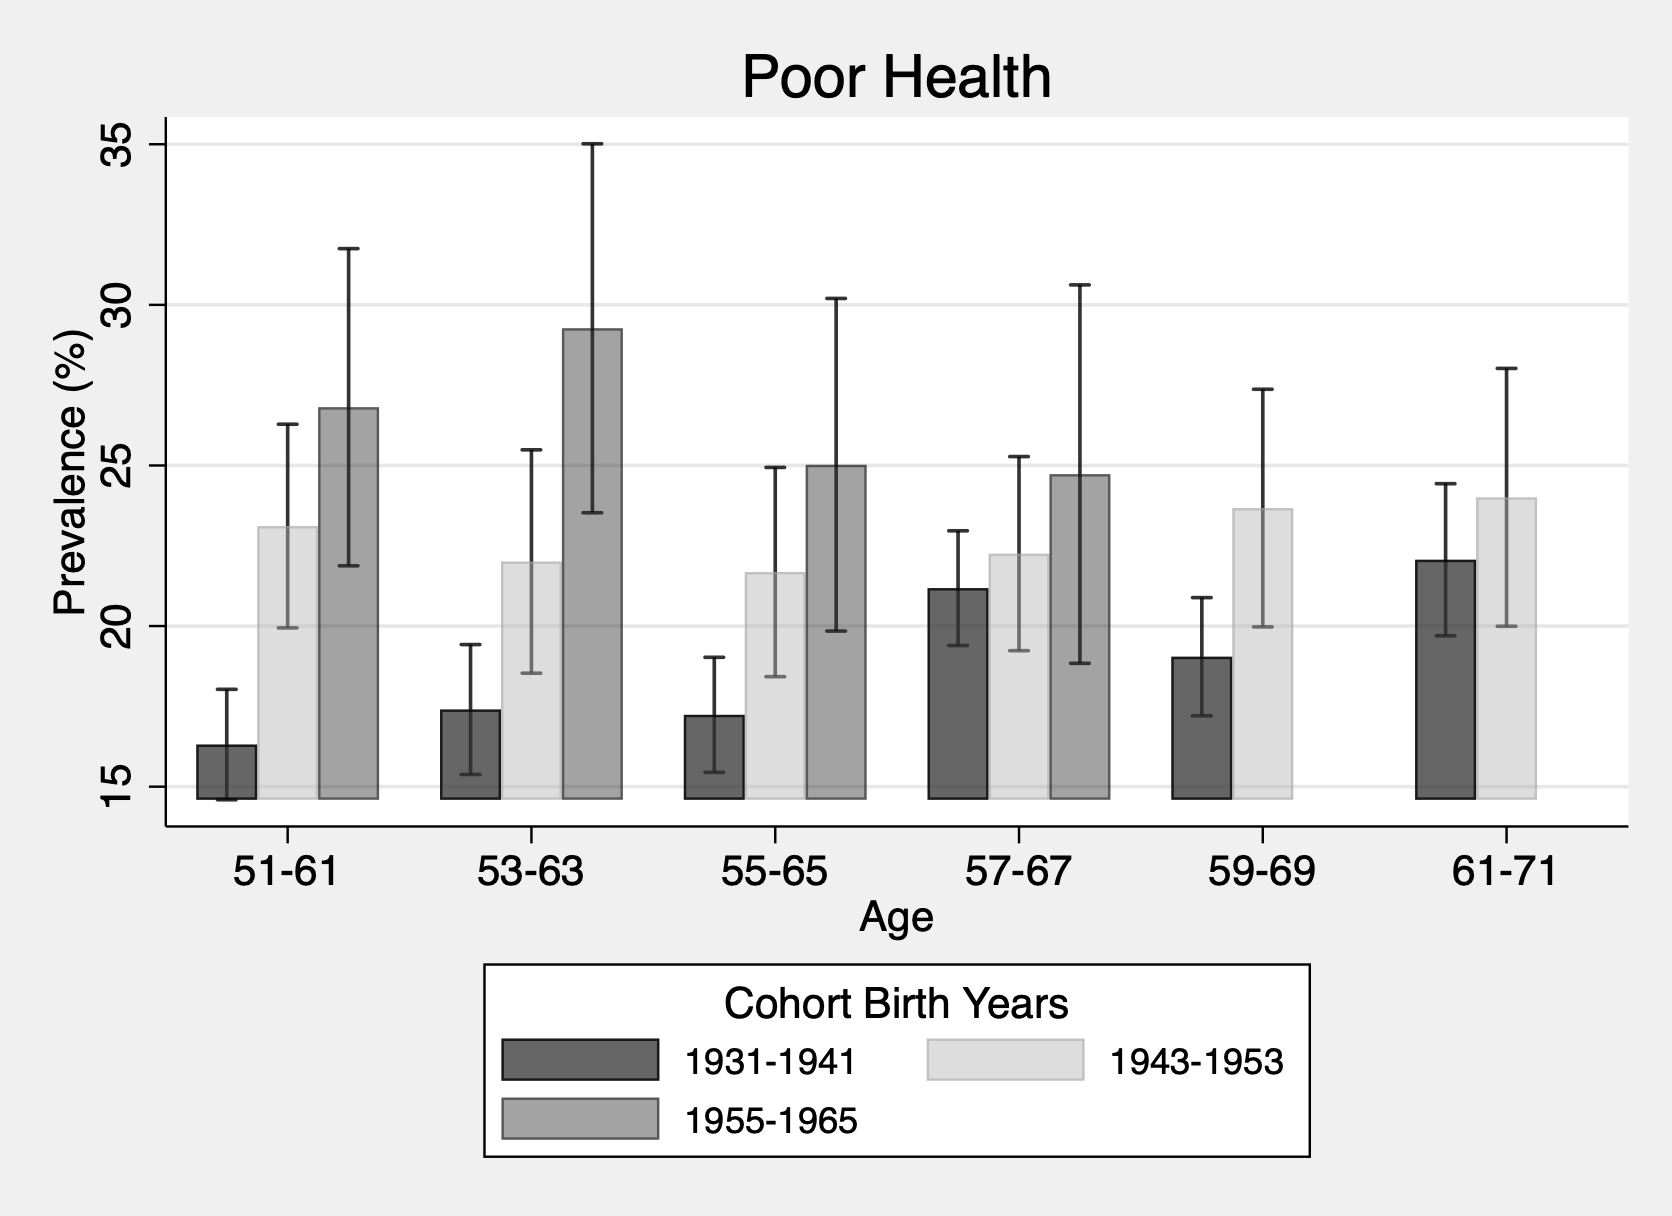
Figures 1–8 show a clear pattern: more recent veteran cohorts report more chronic conditions and worse self-rated health at the same ages than the 1931–1941 cohort. These differences are already evident at ages 51–61 and are largest in the 1955–1965 cohort. With the exception of lung disease, similar but smaller differences are also present in the 1943–1953 cohort.
At ages 51–61, the 1955–1965 cohort has a higher prevalence of all conditions examined than the 1931–1941 cohort. The largest relative increase is observed for stroke (Figure 7), which is more than three times as prevalent in the most recent cohort. Substantial excess prevalence is also seen for arthritis (Figure 1), cancer (Figure 2), diabetes (Figure 3), high blood pressure (Figure 5), lung disease (Figure 6) and fair/poor self-rated health (Figure 8) (all ratios >1.5). Heart disease (Figure 4) is likewise more common in the most recent cohort, although the relative increase is smaller than for other outcomes (ratio 1.39–1.45 across age groups).
Compared with the 1931–1941 cohort, the 1943–1953 cohort already shows higher prevalence of cancer, stroke, arthritis, diabetes, high blood pressure, heart disease and fair/poor self-rated health at the youngest observed ages. These increases are consistently smaller than those seen in the 1955–1965 cohort, suggesting a graded pattern across cohorts. Lung disease is the exception. In the 1943–1953 cohort, lung disease prevalence is initially slightly lower than in the earliest cohort and approximately similar at later ages. By contrast, the 1955–1965 cohort shows a clear, statistically significant increase in lung disease prevalence compared to the earliest cohort.
Figure 1
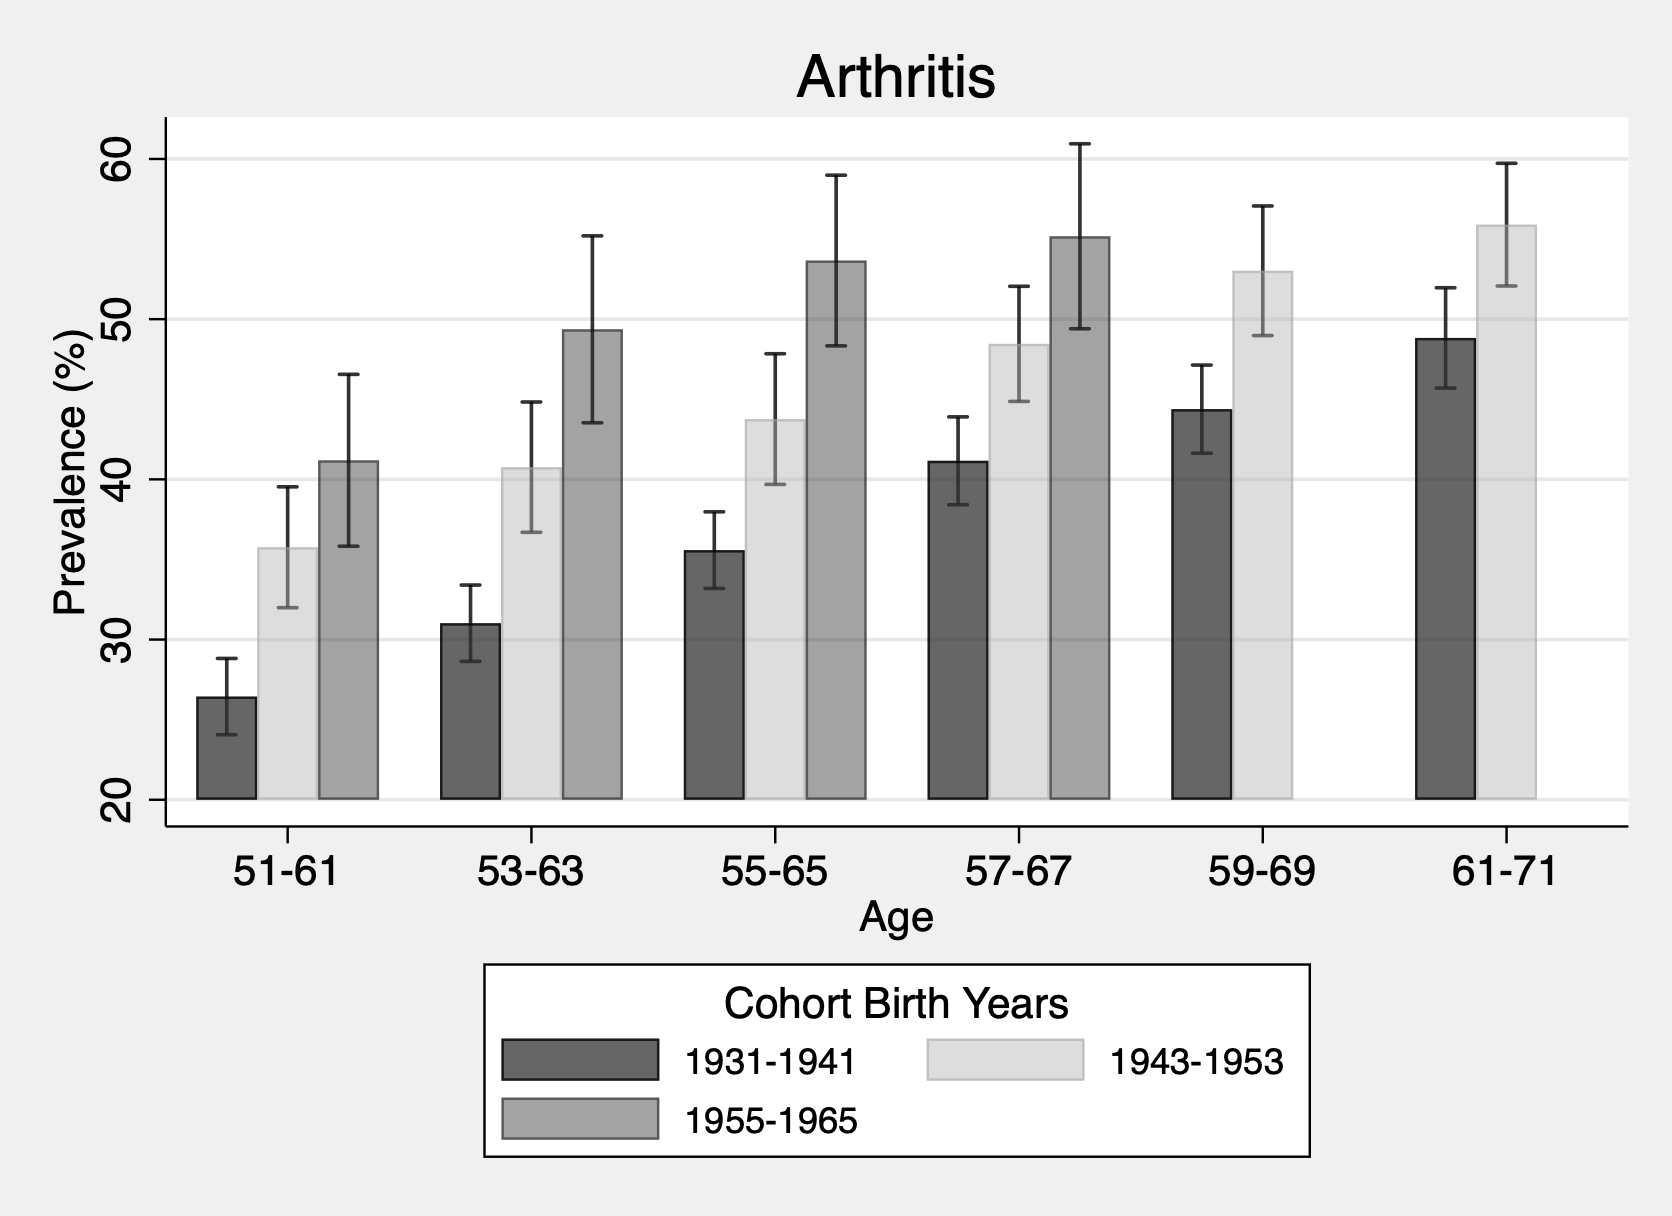
Figure 2
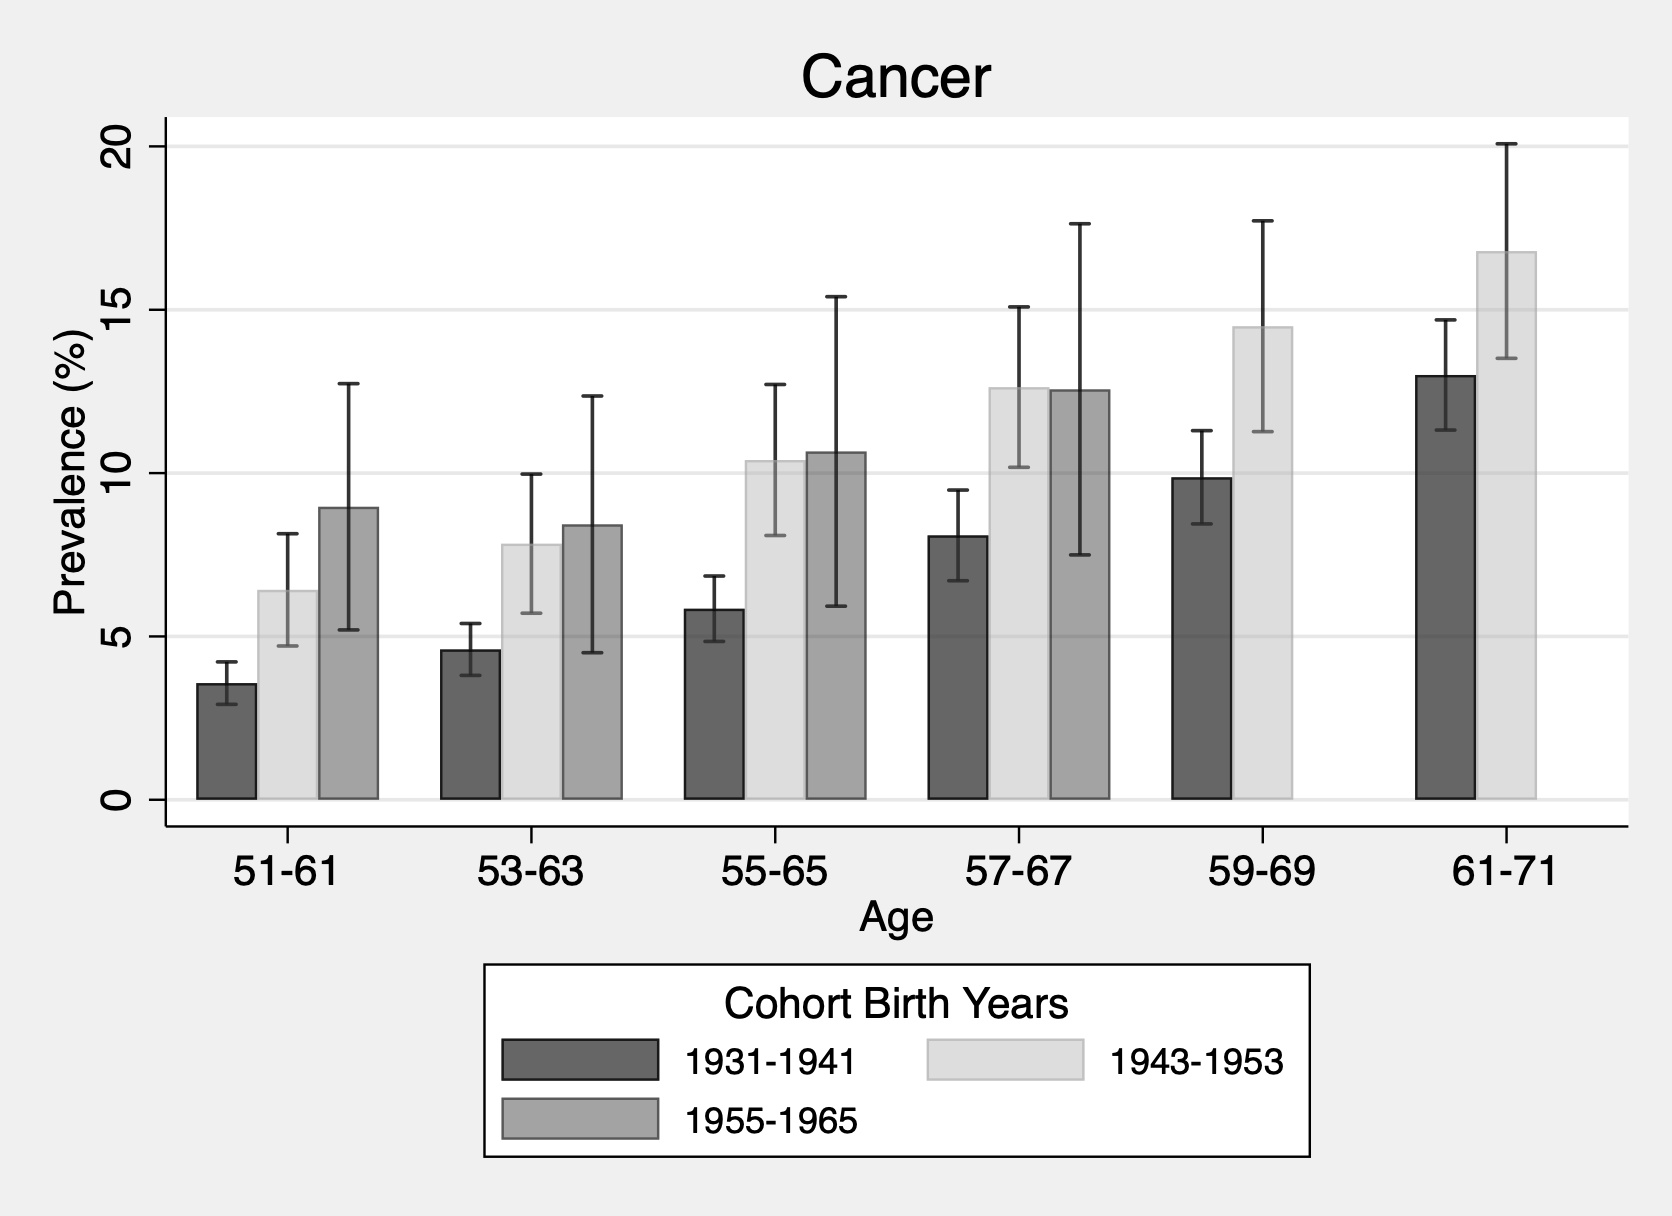
Figure 3
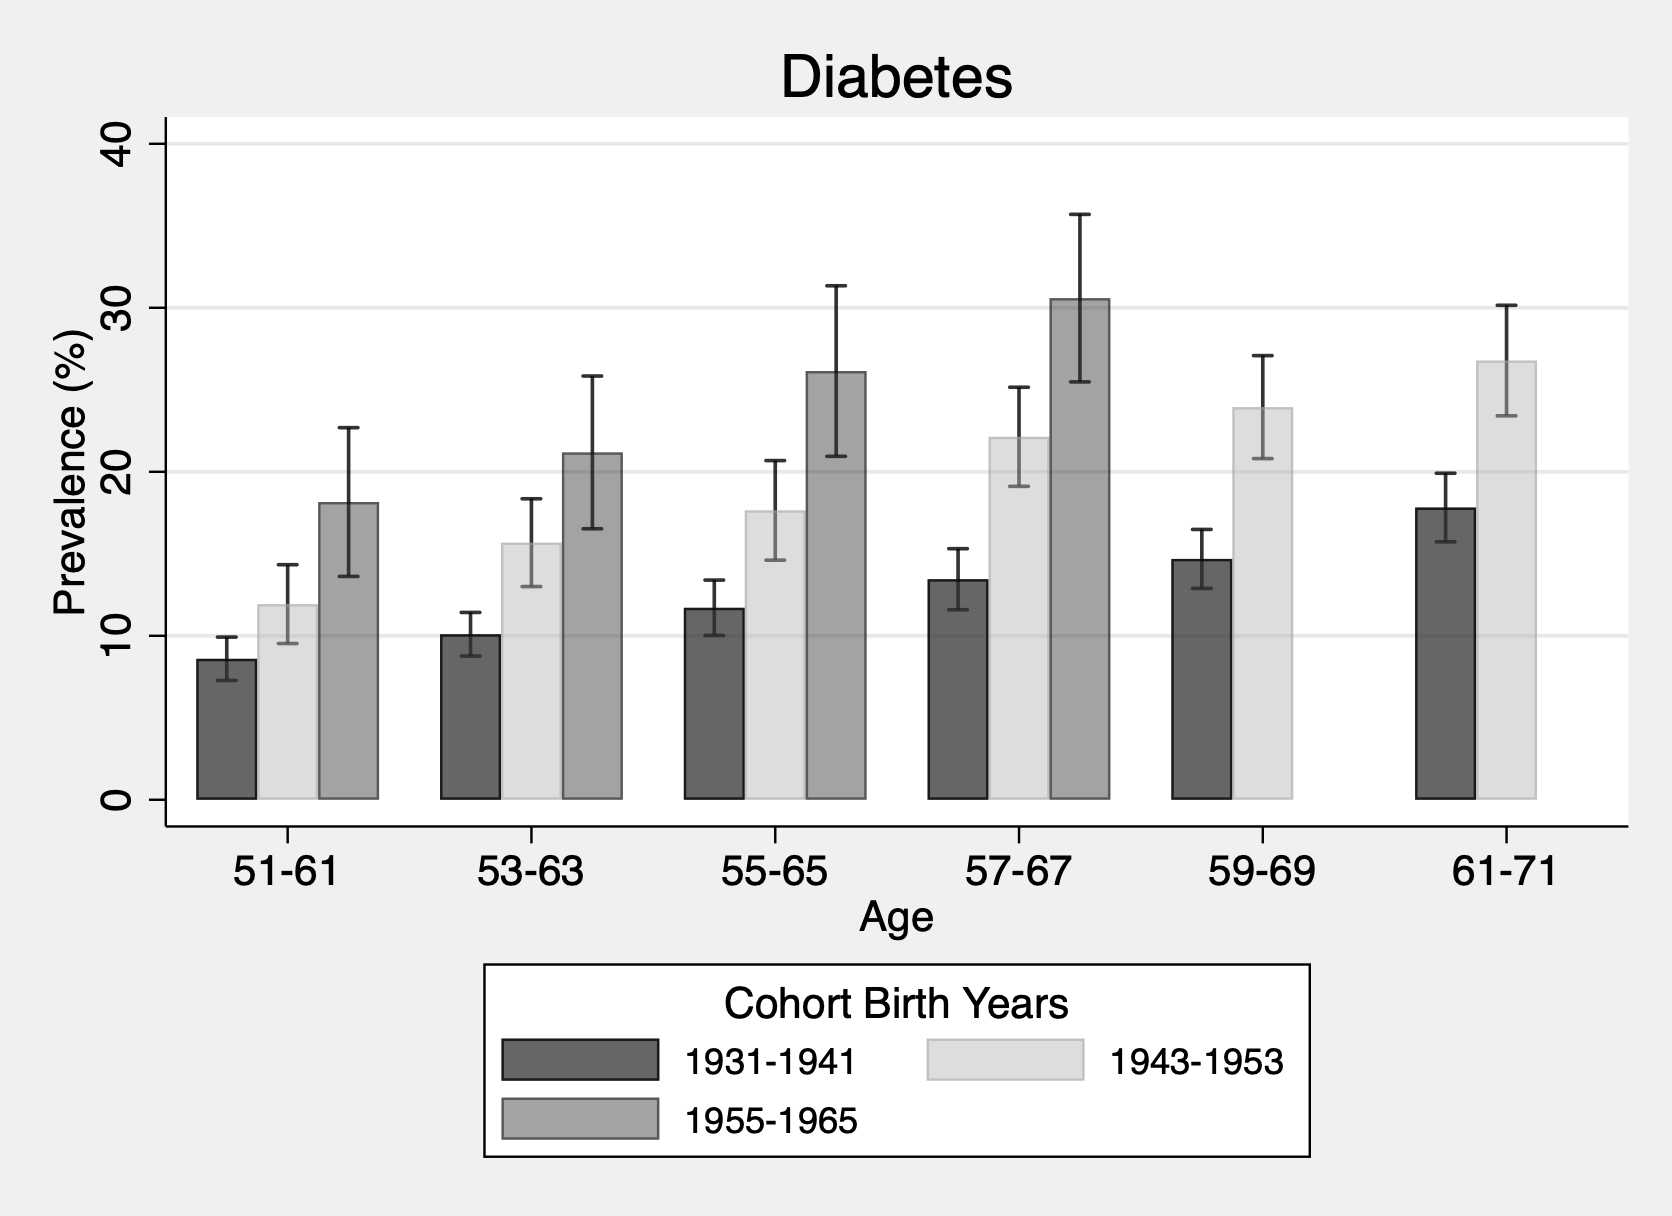
Figure 4
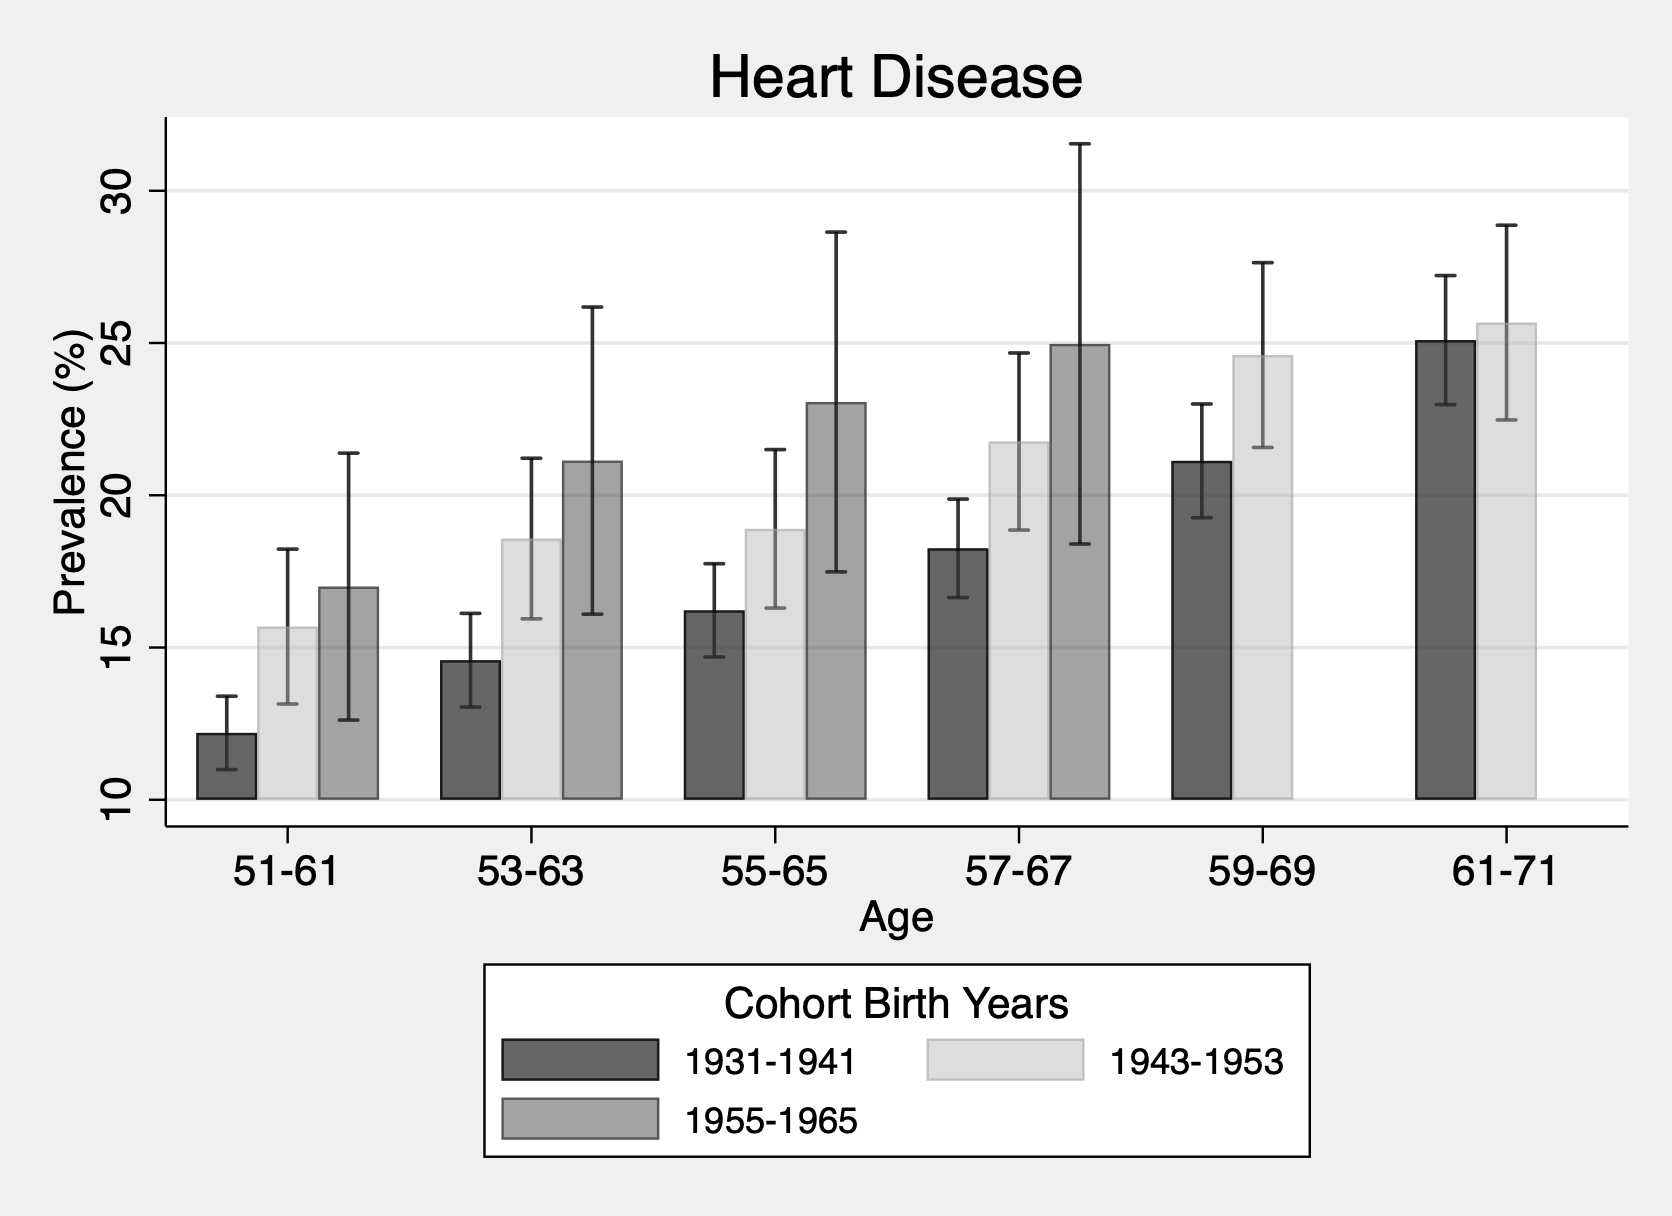
Figure 5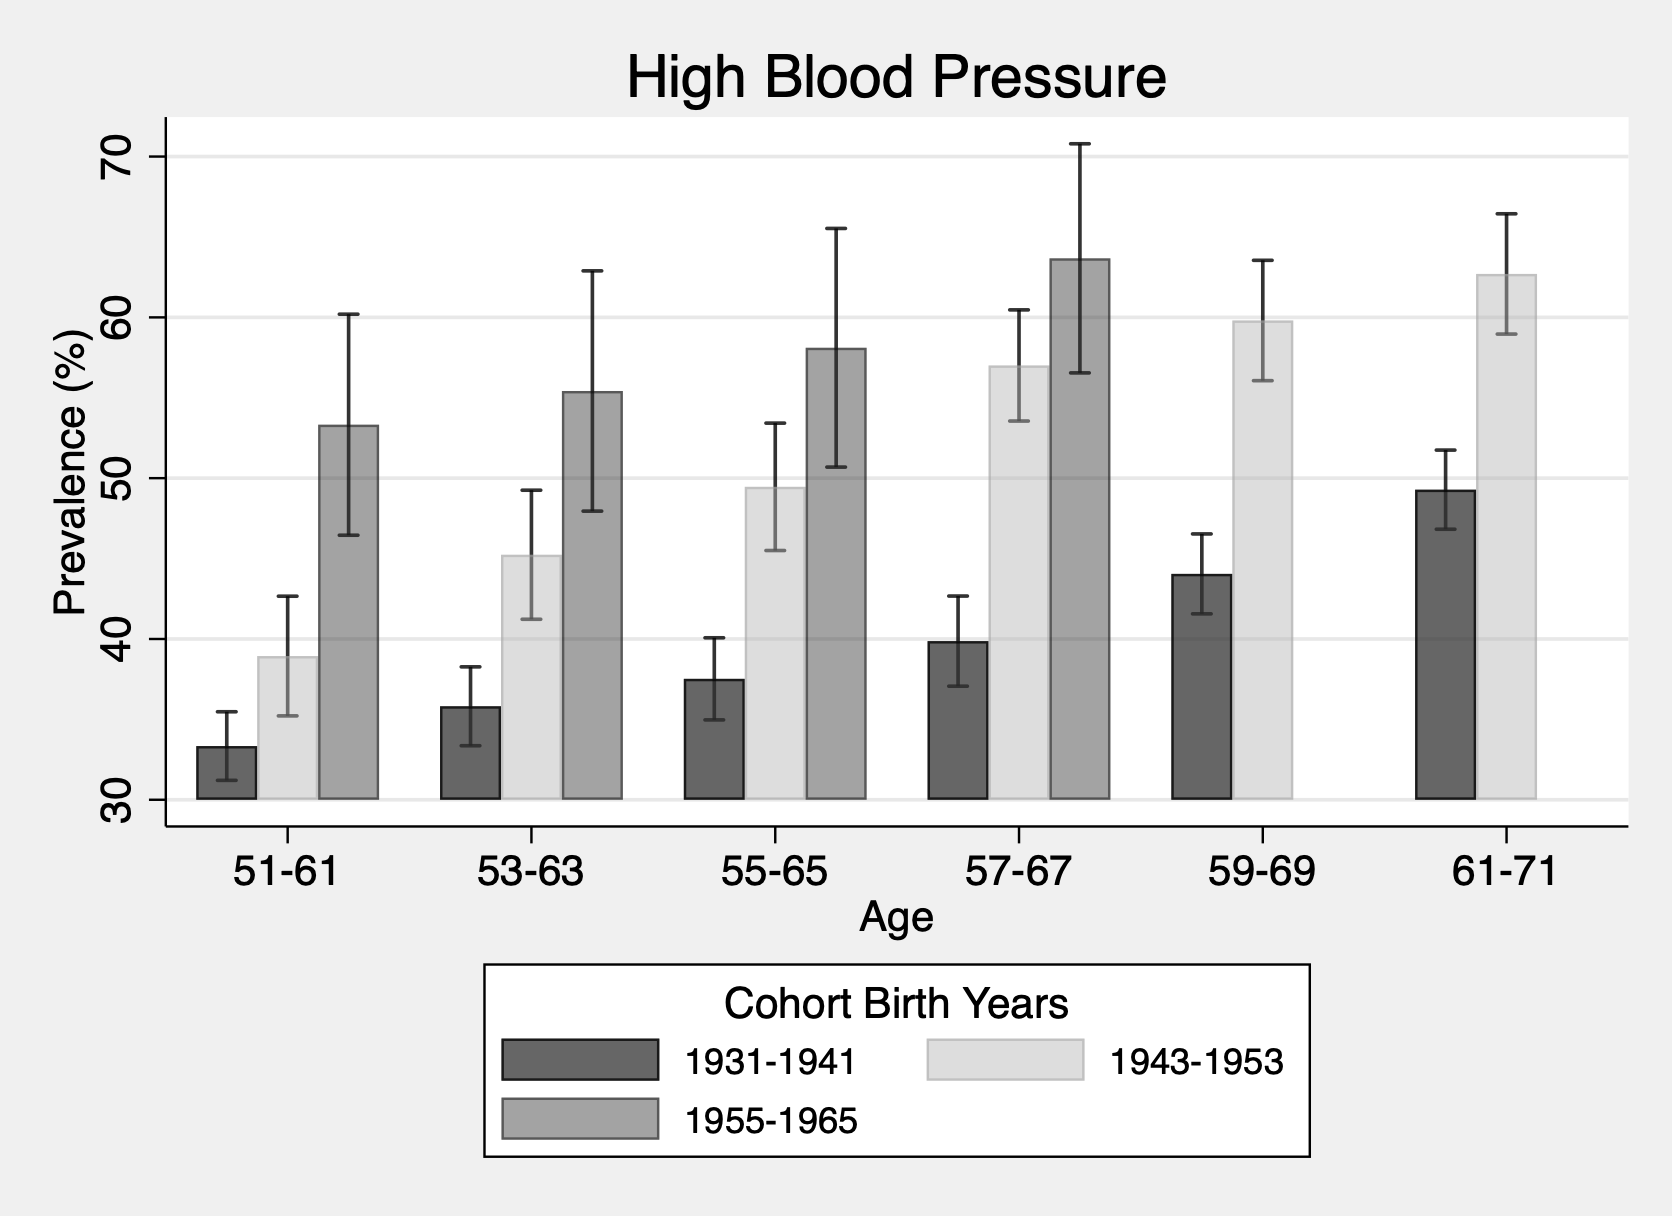
Figure 6
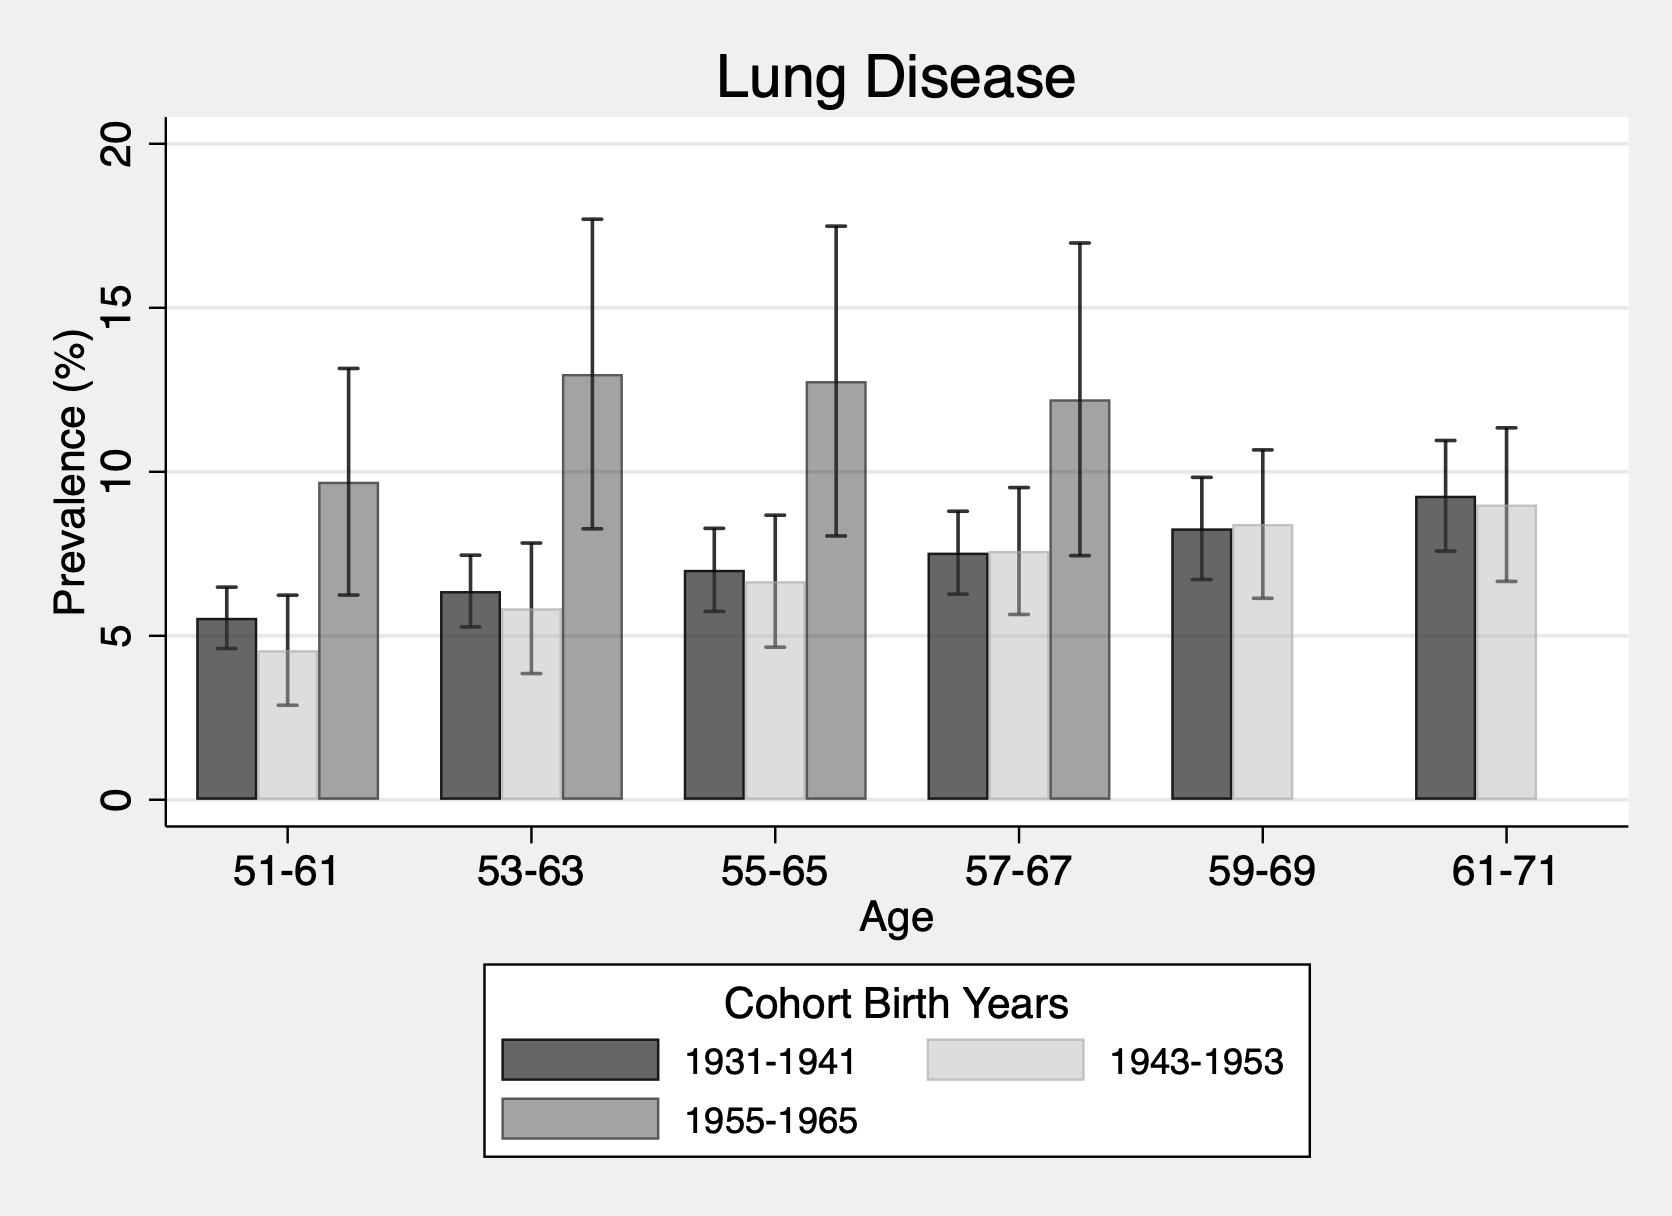
Figure 7
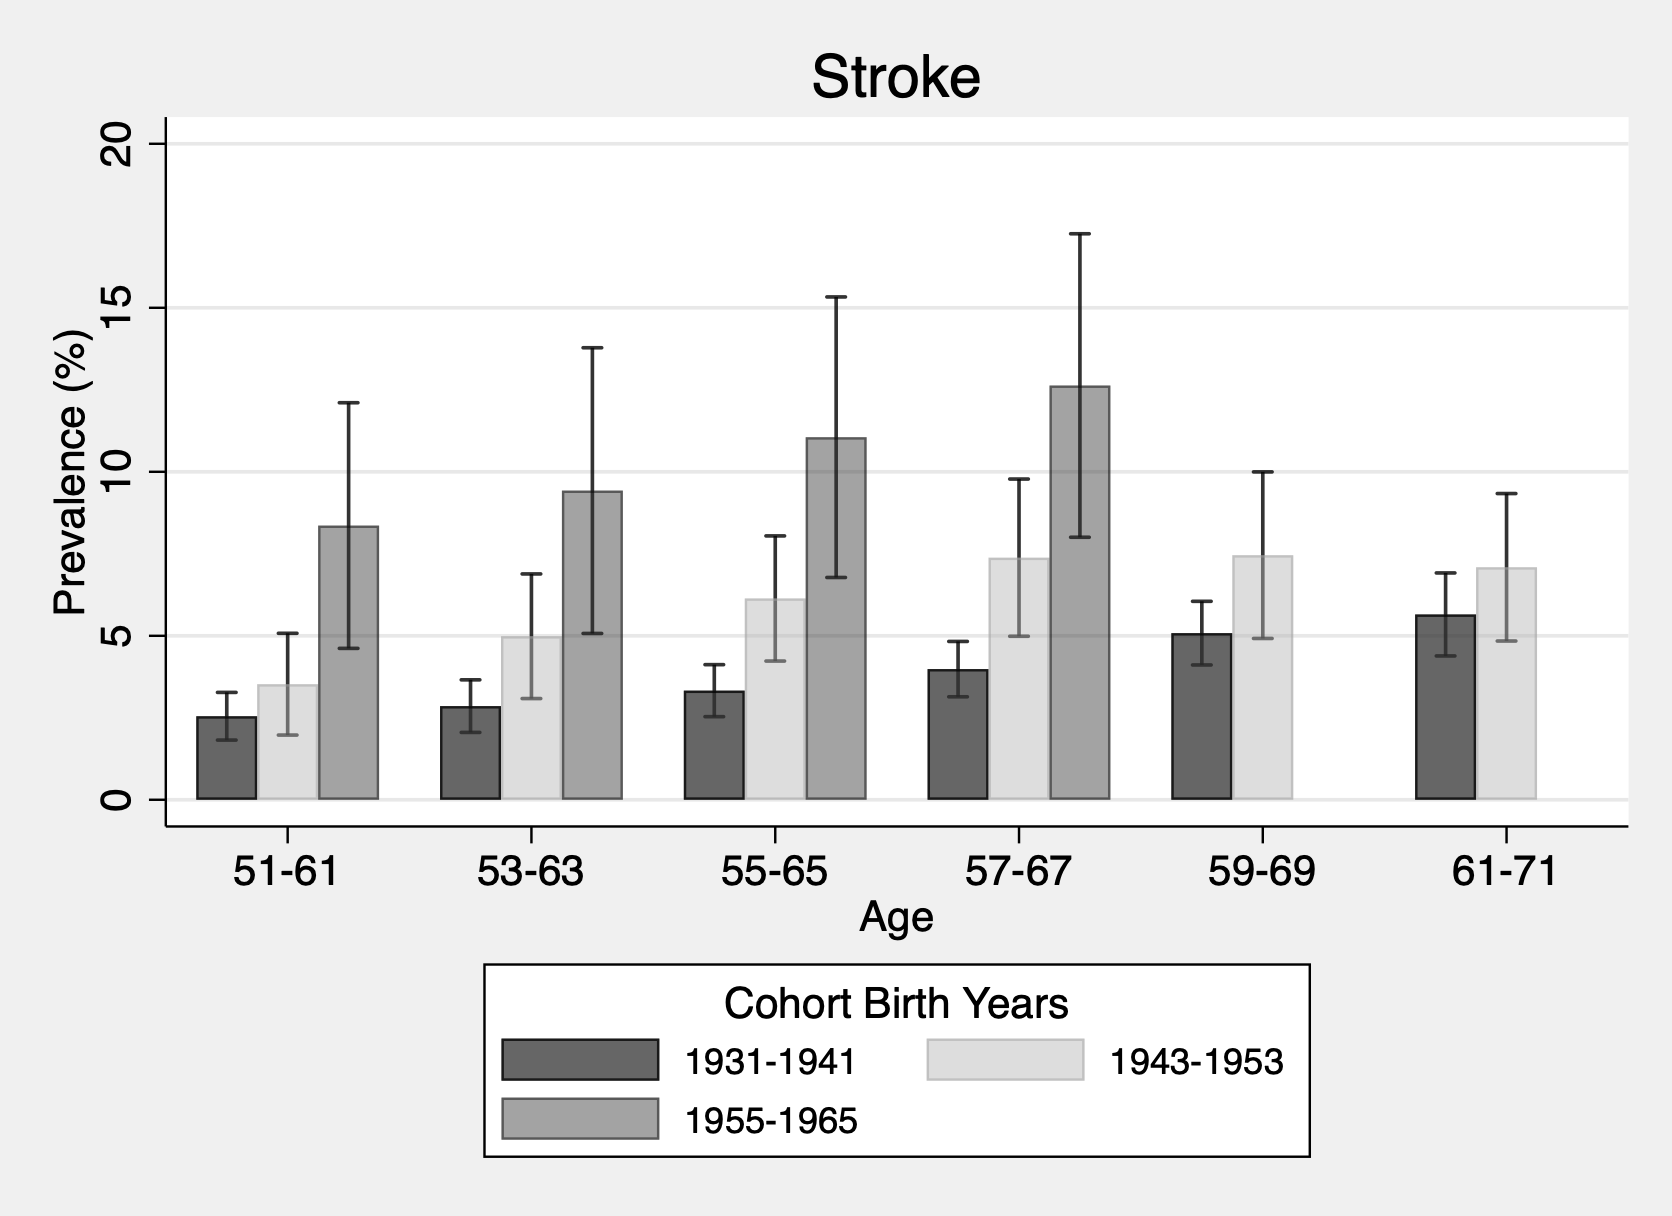
Figure 8
Some of the observed differences were expected for conditions such as diabetes and high blood pressure, because their diagnoses are influenced by screening and awareness of asymptomatic conditions. However, the pattern is not limited to conditions likely to benefit from earlier detection. Pronounced cohort differences are also observed for stroke, arthritis, heart disease and fair/poor self-rated health, and for lung disease in the most recent cohort. This broader consistency suggests that the findings do not simply reflect increased diagnosis of asymptomatic disease.
Discussion
This study shows clear generational differences in chronic disease burden among US veterans. More recent cohorts had worse health profiles than earlier cohorts at the same ages, and these differences were already evident at ages 51–61. Veterans born in 1931–1941 consistently had the most favourable profile, with the lowest prevalence of fair/poor self-rated health and of diagnosed cancer, stroke, arthritis, diabetes, high blood pressure and heart disease. This suggests that the earliest cohort reached late middle age with a lower burden of chronic illness. However, for high blood pressure and, probably, diabetes, some of this apparent advantage would reflect lower detection and treatment rates in earlier periods.
Veterans born in 1943–1953 already showed a broadly worse health profile than the 1931–1941 cohort, with prevalence ratios at ages 51–61 ranging from 1.17 for high blood pressure to 1.80 for cancer. The 1955–1965 cohort had the least favourable profile of all, with higher prevalence for every condition examined. At ages 51–61, diabetes prevalence was more than twice as high, cancer prevalence was 2.5 times as high, and stroke prevalence was more than three times as high as in the earliest cohort. These patterns indicate that successive cohorts are not simply aging in parallel. Rather, more recent cohorts appear to be reaching older ages with substantially greater accumulated morbidity.
The consistency of the differences at ages 51–61 is especially important. In the 1943–1953 cohort, prevalence was higher than in the earliest cohort for seven of the eight outcomes, with lung disease the only exception. In the 1955–1965 cohort, every condition and fair/poor self-rated health were more prevalent than in the earliest cohort. Changes in detection likely contribute to higher prevalence of high blood pressure and diabetes, both of which can remain asymptomatic for long periods. Earlier detection is also plausible for cancer. However, they do not readily explain the similarly consistent increases in symptom-driven conditions and in self-rated health.
The condition-specific patterns also suggest that cohort differences in aging are not uniform. For stroke, diabetes and high blood pressure, the elevated burden observed in more recent cohorts at ages 51–61 persisted across subsequent age groups with relatively constant ratios. For cancer, arthritis, heart disease, and fair/poor self-rated health, relative cohort differences in terms of prevalence ratios were largest at younger ages and tended to narrow with age. This pattern may reflect selective survival, with less healthy individuals disproportionately dying before reaching older age groups, as well as the increasing commonness of these conditions in all cohorts with aging.
Lung disease is the main exception to the otherwise monotonic cohort pattern. The middle cohort is similar and possibly better than the earliest cohort at younger ages, a pattern consistent with the secular decline in smoking. By contrast, the 1955–1965 cohort had substantially higher lung disease prevalence, with prevalence ratios of 1.62 to 2.04 relative to the earliest cohort.
One possible explanation is that this cohort includes some veterans who served during the 1990–1991 Gulf War, among whom respiratory symptoms have been linked to environmental exposures such as airborne hazards and burn pits.15 However, this mechanism is unlikely to explain more than a small share of the observed difference. Only a minority of the 1955–1965 cohort would have been in active service during the Gulf War, and only some of those would have been deployed. In addition, reported deployed-to-nondeployed risk ratios for respiratory diseases among Gulf War-era service members have been around 1.1 to 1.2 depending on the specific condition,16 much smaller than the cohort differences observed here (prevalence ratios of 1.62–2.04).
This study has several limitations. First, the estimates reflect prevalence only among veterans who were alive and observed at each age range. Some of the sickest individuals die early, and this selective survival could be greater in the more recent cohorts. That process could help explain a dip in fair/poor self-rated health with increasing age and why stroke prevalence increases only modestly with age despite the seriousness of the condition. The results should be interpreted as the burden of disease among surviving veterans rather than the lifetime prevalence if people had not died. Second, although the overall patterns are highly consistent, individual cohort comparisons are often not statistically significant. This depends in part on the condition’s prevalence and the resulting precision of the estimates. For example, arthritis is common and differences between Cohorts 1 and 3 are always statistically significant. Less common conditions may exhibit similar or even larger relative differences and still show overlapping confidence intervals. Third, the outcomes are based on self-reported physician diagnoses and may reflect recall error, reporting differences and variation in access to care and diagnosis. Finally, the analysis is descriptive and does not identify the mechanisms underlying cohort differences, including the contributions of military exposures, smoking, obesity, socioeconomic change or healthcare access.
Nevertheless, these results have important implications for population aging and for health systems serving veterans. Higher rates of diagnosed chronic illness will require more medical care per individual. Even if survival improves, individuals will spend more years living with disease and multimorbidity. A declining veteran population therefore does not necessarily imply declining healthcare needs. Rather, earlier onset and persistence of chronic disease in more recent cohorts may sustain or increase demand for long-term management of multiple conditions.
In conclusion, more recent US veteran cohorts report a higher burden of chronic conditions and worse self-rated health at the same ages than earlier cohorts. These differences are already evident by ages 51–61 and are not confined to conditions strongly affected by screening. The findings suggest that more recent cohorts are entering older adulthood with poorer health and may therefore spend more years living with chronic disease and multimorbidity. As the veteran population continues to shift towards more recent cohorts, health systems serving veterans may face growing demand associated with earlier and more sustained chronic illness.
Please specify the URL of your file